CTM Classic™ — FINBEAR™ Module C — October 24, 2026
FINBEAR™ MODULE C — Multi-Layer Technical Analysis
FINBEAR™ Strategic Report — Saturday, October 24, 2026
“When crude sprints and gold takes a seat, the market isn’t looking for shelter: it’s paying a bill.”
| Panel | 18 core assets — US Indices, Currencies, Rates, Commodities, Crypto, Volatility |
| Method | CTM (Cross-Technical Matrix) — 4 layers and a cross-cutting compass (ADX), 24 indicators, 4 charts per ticker |
| Reference date | Friday, October 23, 2026 (EOD close) |
| Crypto | Saturday, October 24, 2026 (24/7 session, morning reading) |
| Produced by | FINBEAR™ — Powered by Pythia™ |
Contents
- Method and Panel
- 🧭 Before You Open the Terminal
- Summary Comparison Table
- PART I — US Indices
- PART II — Currencies & Rates
- PART III — Commodities
- PART IV — Crypto & Volatility
- 📐 Yield Curve
- 🏦 Financial Sector
- PART V — Integrated Cross-Asset Reading
- 📜 Disclaimer & Fantiborsa™ Maxim
Method
FINBEAR™ Module C reads every asset through 4 independent technical layers and a cross-cutting compass, the ADX, each built to capture a different dimension of market behavior. The point isn’t to pile up indicators but to build a multidimensional diagnosis that no single indicator can provide.
The 4 Layers
| Layer | Question | Indicators |
|---|---|---|
| 1. Structure | Where are we on the map | SMA200, SMA50, EMA20, Ichimoku Full, Parabolic SAR, Chandelier Exit |
| 2. Momentum | How hard are we moving | RSI(14), MACD(12,26,9), Stochastic(14,3,3), Williams %R(14), Aroon(25) |
| 3. Flows | Who’s buying and who’s selling | CMF(20), Force Index(13), OBV, Volume by Price |
| 4. Volatility | How unstable is the ground underfoot | ATR(14), Bollinger Bands(20,2), Keltner Channels(20,2,10), Ulcer Index(14) |
🧭 Cross-cutting compass: ADX(14) — It belongs to no layer. It cuts across all four. It tells you whether the market is going anywhere, regardless of direction.
Structure — Defines the regime: bullish, bearish or in transition. The SMA200 is the dividing line between bull and bear; the SMA50 is the tactical line. Ichimoku projects the trend forward — not just where we are, but where the structure is taking us.
Momentum — Measures the speed and acceleration of price. Momentum breaks away from structure before price does. It’s the early-warning system.
Flows — Price is what the market does; flows are what the market thinks. A rally without flows is a mirage; a decline on rising volume is a verdict. Where there’s no volume (spot metals and energy, currency indices, rates and volatility), flows are shown as n/a.
Volatility — It has no direction. It’s the cost of staying in the market. The Ulcer Index measures drawdown risk: not how much you make, but how much you stand to lose along the way.
🧭 The ADX as a Cross-Cutting Compass
The ADX (Average Directional Index) doesn’t tell you where the market is going. It tells you whether the market is going anywhere at all. That’s why it belongs to none of the 4 layers but runs through all of them, confirming whether what the other indicators measure has a coherent direction or is just noise.
- ADX < 20: no directional trend, a sideways and treacherous phase.
- ADX 20-25: trend forming, direction is emerging but not yet confirmed.
- ADX > 25: confirmed trend.
- ADX > 40: extreme trend, exceptional directional strength.
Direction comes from +DI (upside pressure) and −DI (downside pressure). The ADX measures only the strength of the move.
Diagnosis and Operations: two documents, one method
This Module C is the diagnosis. It reads the market, identifies the regimes, measures the forces in play and sets out the scenarios. The operational translation (decision dashboard, key levels, summary verdicts for those who have to act) is in the CTM Signal™. Same method, different job. If you want to understand the market, start here; if you want to know what to do with it, carry on to the Signal.
Panel of 18 Assets
| # | Ticker | Asset | Role in the Panel |
|---|---|---|---|
| 1 | $SPX | S&P 500 | US equity benchmark — the center of gravity |
| 2 | $NDX | Nasdaq 100 | Tech concentration — the 100 large-cap leaders, the canonical gauge of the AI trade |
| 3 | $COMPQ | Nasdaq Composite | Nasdaq breadth — more than 3,000 stocks, the thermometer of how wide innovation runs |
| 4 | $INDU | Dow Jones Industrial | Value and cyclicals — the old guard |
| 5 | $SOX | Philadelphia Semiconductor | AI infrastructure — the leading cyclical indicator |
| 6 | $USD | US Dollar Index (DXY) | Currency — the universal denominator |
| 7 | $EURUSD | Euro/Dollar | Exchange rate — the filter between Wall Street and a European portfolio |
| 8 | $TNX | 10-Year Treasury Yield | Rates — the price of time |
| 9 | $MOVE | ICE MOVE Index | Bond volatility — the “VIX of bonds” |
| 10 | $GOLD | Spot gold | Safe haven — the thermometer of fear and distrust |
| 11 | $SILVER | Spot silver | Hybrid metal — safe haven and industrial demand |
| 12 | $COPPER | Spot copper | Macro-cyclical — “Dr. Copper”, the industrial barometer |
| 13 | $WTIC | WTI crude spot | US energy — domestic demand and geopolitics |
| 14 | $BRENT | Brent crude spot | Global energy — the international benchmark |
| 15 | $BTCUSD | Bitcoin | Macro crypto — the liquidity canary |
| 16 | $ETHUSD | Ethereum | Infrastructure crypto — the DeFi and smart-contract platform |
| 17 | $SOLUSD | Solana | Momentum crypto — the thermometer of speculative flows |
| 18 | $VIX | Equity volatility group | Fear, protection, positioning |
After the four PARTS, the 📐 Yield Curve reads the Treasury term structure and the 🏦 Financial Sector (XLF, KBWB, KRE) is observed separately, outside the panel aggregates.
🧭 Before You Open the Terminal
- Energy → The only engine running in the panel: $BRENT at 116.90 (+3.30%) on a new high for the period with RSI 72.2, $WTIC at 103.45 (+4.00%) with ADX 30.3 and +DI nearly four times −DI. Price is above the upper Bollinger on both — a strong run, but stretched in the short term.
- Tech → The generals are falling back: $SOX ends the week leaning on its SMA200 (10,690) with −DI at 41.5, $NDX has −DI nearly triple +DI, $COMPQ posts the deepest outflow among the indices (CMF −0.136). The old guard holds. $INDU has a bullish MACD and an Ulcer of 0.45, the lowest in the equity panel.
- Precious metals → The haven isn’t doing its job: $GOLD closes below 4,000 (3,994.60), outside both Bollinger and Keltner; $SILVER prints a full-bodied candle closing on its low, RSI 31.2, the lowest in the panel. With the dollar trending ($USD, ADX 37.6) and the 10-year near 5%, the opportunity cost of holding metal weighs more than fear does.
- Fear → High on two fronts: $VIX at 19.45, out above the Ichimoku cloud with ADX 36; $MOVE at 103.31, lower on Friday but still more than a third above its 200-day average. Meanwhile the 10-year is pulling back to its tactical average, so the rate stress is in the volatility, not in the level.
- Verdict → 🔴 Fantiborsa’s take: a one-engine market, and the engine is energy, with everyone else paying for the fill-up. Oil up, dollar up, fear up; tech, precious metals, the euro and crypto down. When the price of a barrel becomes the director, anyone holding only the stars of the last few months finds out they didn’t make the cast.
🔴 Bar: STAY — the week changed the panel’s director. The semiconductor, gold and Brent sections are the ones to read in full.
Summary Comparison Table — All 18 Assets
| Ticker | Price | Chg % | Trend | RSI(14) | ADX(14) | +DI / −DI | Dominant Signal |
|---|---|---|---|---|---|---|---|
| $SPX | 7,623.68 | −0.52% | Underlying uptrend, short-term correction | 42.15 | 14.39 | 16.65 / 30.58 | 🔴 SMA50 lost, −DI dominant |
| $NDX | 28,957.53 | 0.00% | Short-term correction within an underlying uptrend | 36.67 | 24.79 | 14.12 / 39.68 | 🔴 −DI nearly triple, below S1, Aroon Down 100 |
| $COMPQ | 25,955.34 | −0.21% | Short-term correction within an underlying uptrend | 38.01 | 21.85 | 14.72 / 38.58 | 🔴 Deepest outflow among US indices (CMF −0.136) |
| $INDU | 52,215.16 | −1.23% | Recovery since early October, pausing | 52.48 | 20.43 | 29.52 / 21.46 | 🟡 Constructive recovery, SAR flipped Friday |
| $SOX | 10,779.46 | +0.44% | Vertical drop all the way to the SMA200 | 32.31 | 25.55 | 15.08 / 41.45 | 🔴 Confirmed downtrend, testing the SMA200 |
| $USD | 101.75 | +0.18% | Uptrend, retracing | 55.32 | 37.56 | 21.29 / 16.46 | 🟡 Bull pausing on the EMA20/Kijun |
| $EURUSD | 1.1205 | −0.14% | Downtrend, in a sideways base | 35.18 | 46.94 | 11.11 / 25.89 | 🔴 ADX 46.9 with −DI dominant, sideways base 1.113-1.127 |
| $TNX | 4.988% (49.88) | +0.71% | Underlying uptrend, correcting | 40.71 | 30.27 | 22.45 / 27.55 | 🟡 Correction onto the SMA50, −DI above +DI, ATR near its six-month high |
| $MOVE | 103.31 | −3.30% | Uptrend (elevated stress) | 55.76 | 31.00 | 32.06 / 18.04 | 🔴 High bond stress: MOVE +34% above SMA200, 95-114 band |
| $GOLD | 3,994.60 | −0.75% | Downtrend | 33.40 | 23.23 | 10.91 / 29.96 | 🔴 Break below 4,000, double exit from the channels |
| $SILVER | 53.88 | −1.29% | Downtrend | 31.24 | 30.04 | 9.94 / 30.51 | 🔴 July lows broken, ADX 30 |
| $COPPER | 6.465 | +1.62% | Sideways (correction within the range) | 44.76 | 10.02 | 33.38 / 44.36 | ⚪ ADX 10, 6.28-6.82 band |
| $WTIC | 103.45 | +4.00% | Uptrend | 65.87 | 30.32 | 28.17 / 7.58 | 🟢 Above 100, ADX 30 and rising |
| $BRENT | 116.90 | +3.30% | Uptrend | 72.20 | 20.99 | 38.74 / 16.98 | 🟢 New period high, overbought |
| $BTCUSD | 80,720.37 | −0.50% | Corrective within a bullish structure | 43.87 | 16.90 | 18.53 / 21.45 | 🟡 Eroding below the SMA50, trendless ADX |
| $ETHUSD | 2,377.20 | −0.35% | Short-term downtrend within a bullish annual structure | 37.82 | 27.68 | 15.44 / 25.27 | 🔴 Confirmed downtrend (ADX 27.7, −DI dominant) |
| $SOLUSD | 102.12 | −0.64% | Short-term downtrend within a bullish annual structure | 37.25 | 25.23 | 16.07 / 24.83 | 🔴 Downtrend just confirmed, oscillators oversold |
| $VIX | 19.45 | +2.21% | Uptrend (volatility rising) | 61.30 | 35.95 | 38.59 / 8.68 | 🔴 Volatility uptrend confirmed (ADX 36, break above the Kumo) |
Note: ADX values in bold flag a strong directional trend (>25). $TNX shown as percentage yield; crypto taken on Saturday, October 24, with the session still open.
PART I — US INDICES
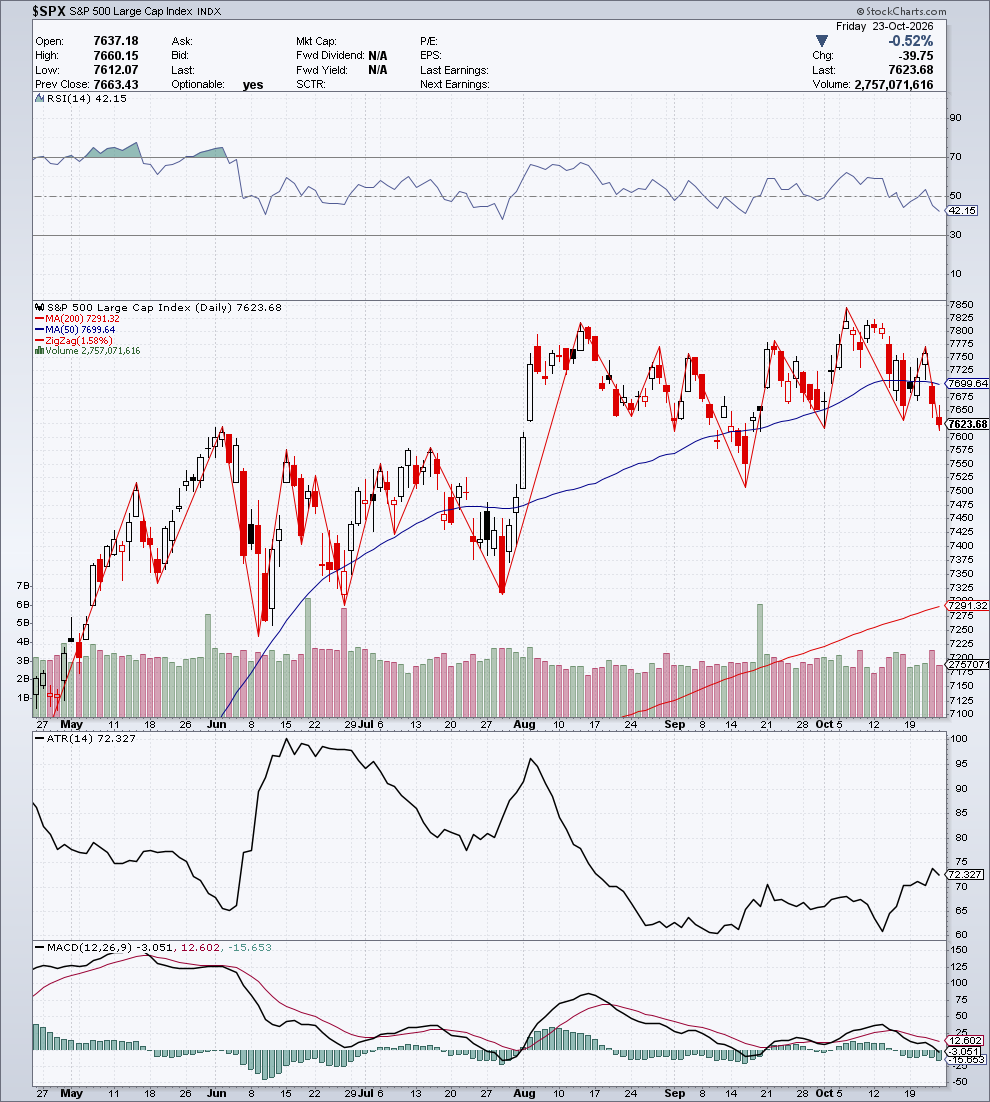
📊 S&P 500 ($SPX) — 7,623.68
Date: Friday, October 23, 2026 | Change: −39.75 (−0.52%) | Volume: 2.76bn
Daily range: 7,612.07 – 7,660.15 | Prev. Close: 7,663.43
Indicator Table
| Indicator | Value | Signal | Notes |
|---|---|---|---|
| Trend | Underlying uptrend, short-term correction | 🟡 | Price below SMA50, above SMA200; lower highs and lower lows since October 6 |
| SMA 200 | 7,291.32 | Below price | +4.56% |
| SMA 50 | 7,699.64 | Above price | −0.99% — tactical average lost |
| Zig Zag (1.58%) | Oct 6 high ~7,850 → lower high Oct 20 → new low 7,612 | 🔴 | Short-term bearish sequence |
| RSI (14) | 42.15 | ⚪ | Below 50, well clear of oversold |
| MACD (12,26,9) | −3.05 / 12.60 | 🔴 | Histogram −15.65; line below the signal and just below zero |
| ATR (14) | 72.33 | ↑ | Climbing off its early-October low |
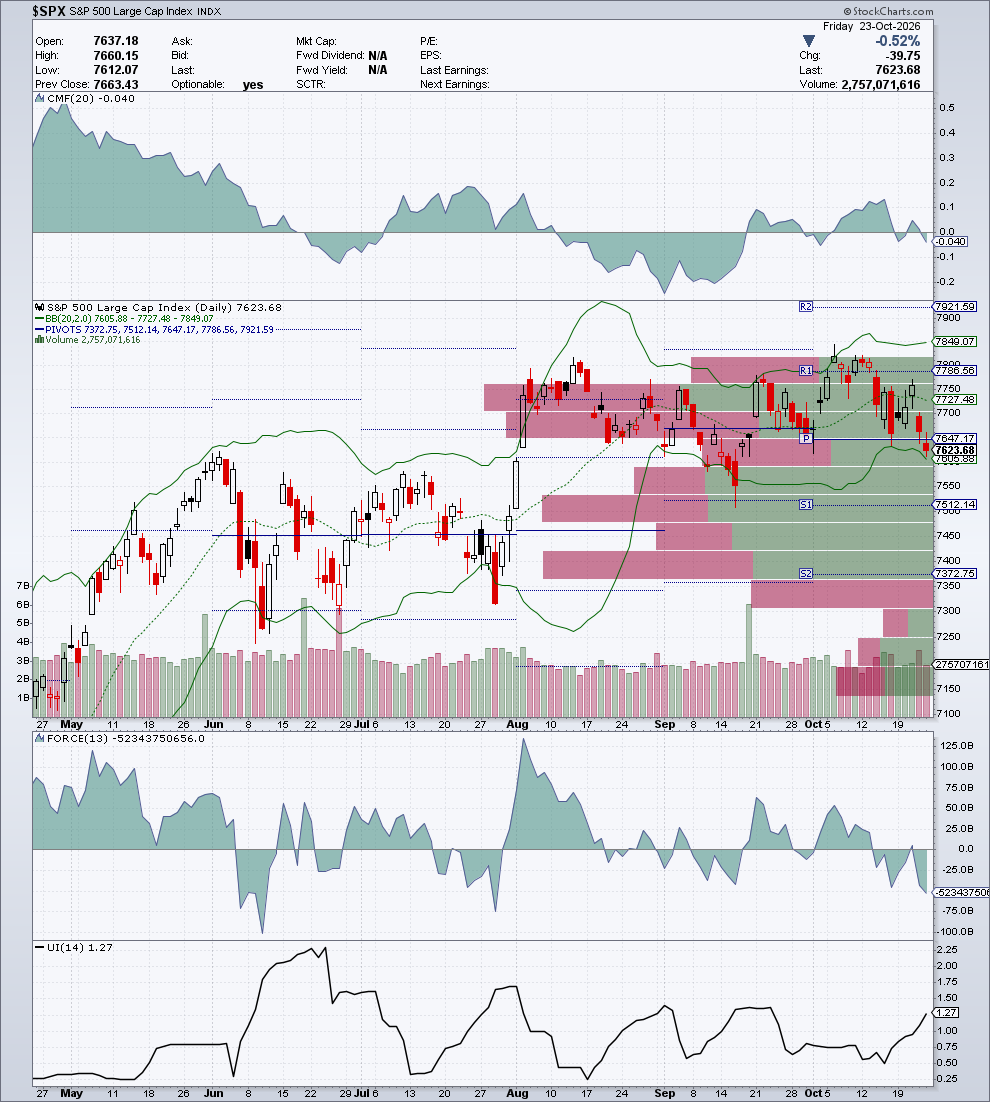
| Bollinger (20,2) | 7,605.88 / 7,727.48 / 7,849.07 | lower band | Price hugging the lower band |
| Pivot Points | S2 7,372.75 · S1 7,512.14 · P 7,647.17 · R1 7,786.56 · R2 7,921.59 | below P | Close below the central pivot |
| Volume by Price | clusters at 7,600-7,850 and 7,150-7,350 | — | Price sits on the lower edge of the wider trading zone |
| CMF (20) | −0.040 | 🔴 | Mild outflow, now below zero |
| Force Index (13) | −52.34bn | 🔴 | Selling pressure |
| Ulcer Index (14) | 1.27 | low, rising | Drawdown contained but growing |
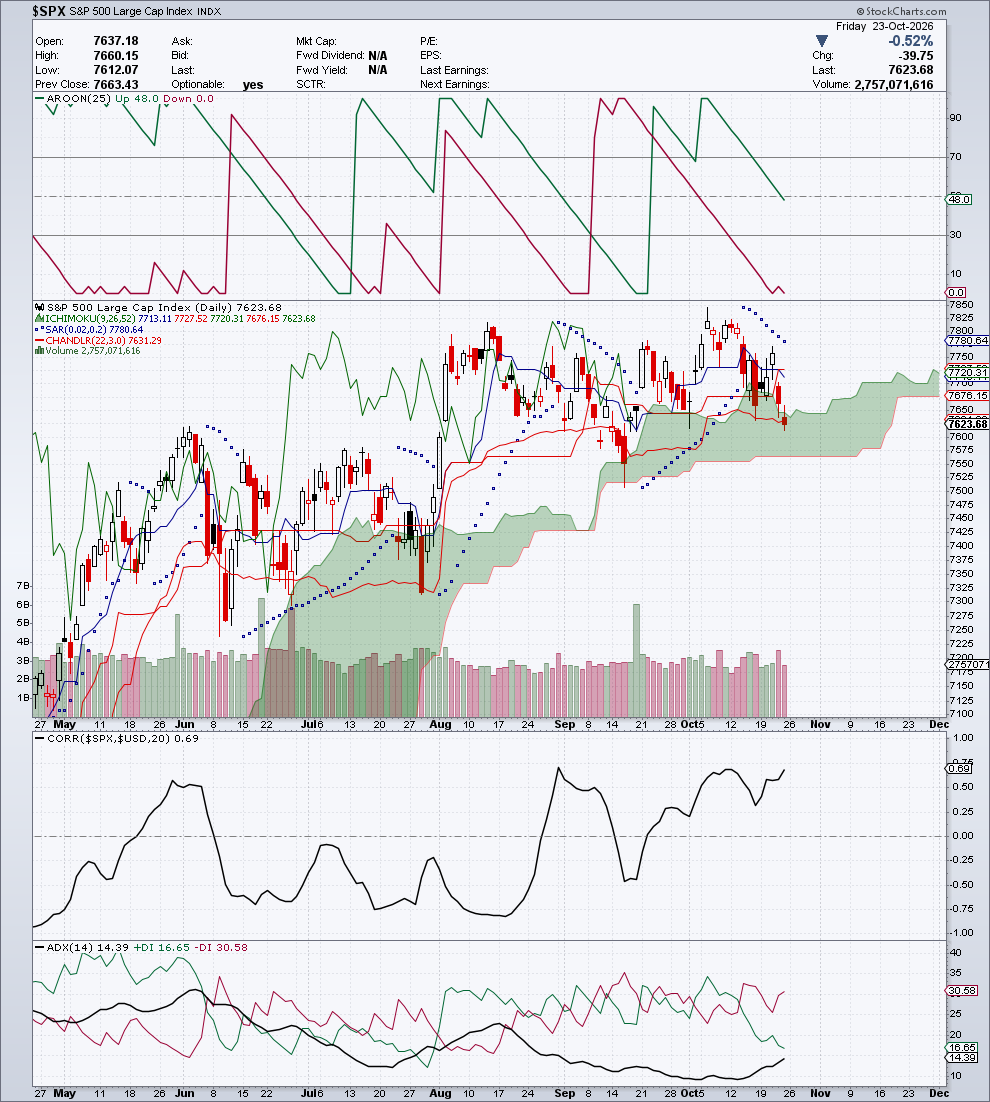
| Ichimoku Full | 7,713.11 / 7,727.52 / 7,720.31 / 7,676.15 | 🔴 | Price in the lower part of the Kumo; Tenkan below Kijun; cloud projected above price |
| Parabolic SAR | 7,780.64 | 🔴 | Above price (+2.06%) |
| Chandelier Exit (22,3) | 7,631.29 | 🔴 | Price just below the exit level for long positions |
| Aroon (25) | Up 48 / Down 0 | ⚪ | No recent high and no new low over 25 sessions: sideways phase |
| Correlation vs $USD (20) | +0.69 | + | Direct and strong: the index and the dollar move together |
| ADX (14) | 14.39 (+DI 16.65 / −DI 30.58) | 🔴 | Weak trend, but −DI nearly double +DI |
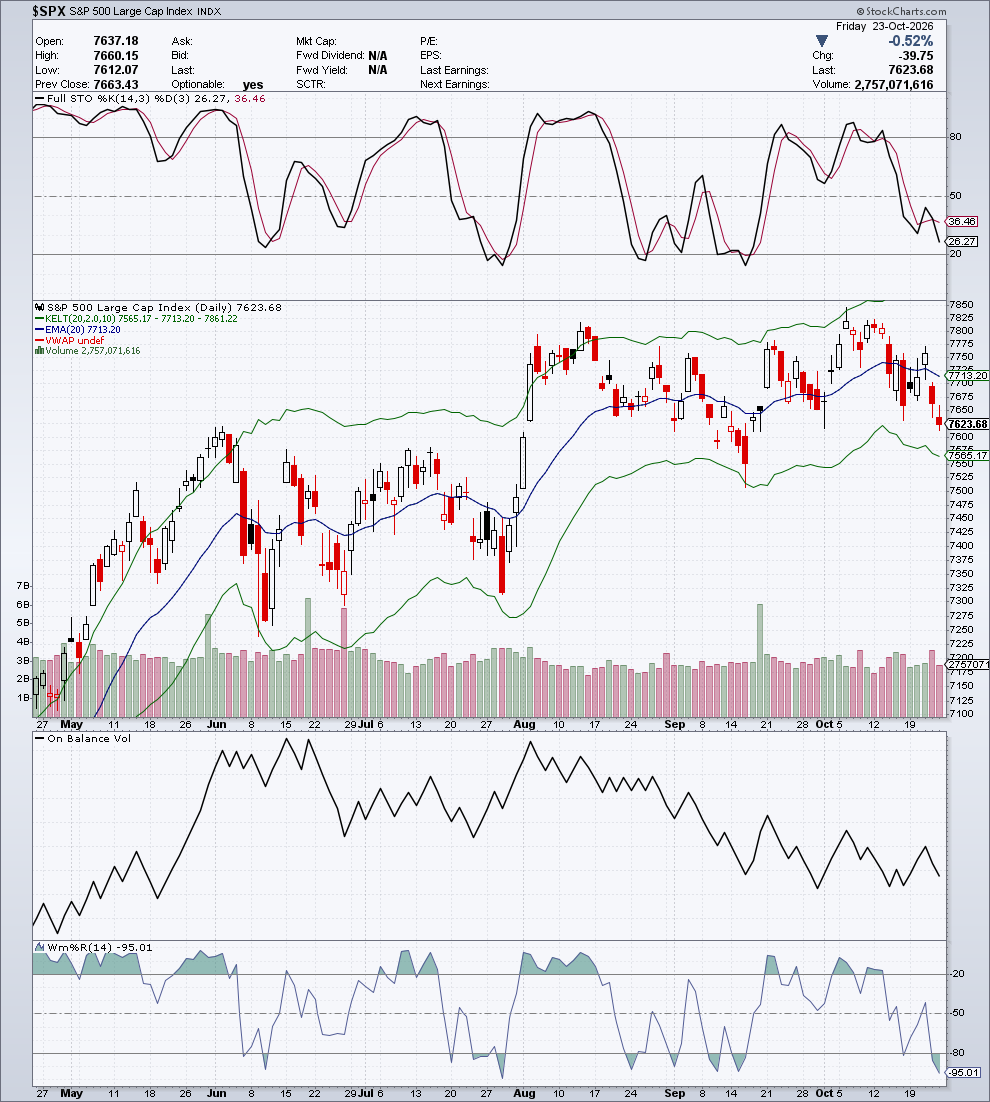
| Keltner Channels (20,2,10) | 7,565.17 / 7,713.20 / 7,861.22 | lower half | Inside the channel, below the midline |
| EMA (20) | 7,713.20 | Above price | −1.16% |
| VWAP | n/a | — | Not available on the index |
| Stochastic (14,3,3) | 26.27 / 36.46 | ⚪ | Sliding toward oversold |
| OBV | falling | 🔴 | Declining since mid-August, fresh leg lower |
| Williams %R (14) | −95.01 | 🟠 | Short-term oversold |
Analytical Commentary
Quantitative frame. The S&P’s Compass captures a contested regime. The short- and medium-term readings pull in opposite directions and reliability is suspended, while the underlying trend stays bullish and solid. Inside that frame the 4 layers tell the same story of friction: the long-term structure is intact, the short term has lost its bearings and the seller has the wheel.
Candlestick. The October 23 candle is red with a small body: open 7,637, high 7,660, low 7,612, close 7,623. The body covers less than a third of the session’s range, with shadows on both sides: indecision, not panic. But it’s indecision that shows up at a new low in the sequence, because the October 16 low has given way.
Moving Averages. The SMA50 (7,699) is gone. Price closes 1% below the tactical average and below the EMA20 (7,713). The SMA200 (7,291) is still a long way down, at +4.56%, and still rising: the structural cushion is there, and it’s a thick one. This reads as a correction inside a bull market, not a change of regime.
Ichimoku Kinko Hyo. Price has slipped into the lower part of the cloud, with the Tenkan (7,713) below the Kijun (7,727): a short-term bearish cross. The SAR sits above price at 7,780 and the close is just under the Chandelier (7,631). That’s two exit signals for short-term longs, not yet a structural break.
Bands & Levels. Price is hugging the lower Bollinger band (7,605) and sits below the central pivot (7,647). The first pivot support is S1 at 7,512, which lines up with a support zone already tested in mid-September. Below that is S2 at 7,373. Overhead, the barrier is the 7,700-7,727 band (SMA50, EMA20, Kijun). As long as price stays under that ceiling, every bounce is just a bounce, not a reversal.
Oscillators & Flows. The MACD line has crossed below its signal line and sits just under zero; the ADX is low (14.4) but −DI (30.6) is nearly double +DI (16.7): little directional strength, and all of it on the sellers’ side. Flows agree: CMF below zero (−0.040), Force Index negative, OBV falling. Williams %R at −95 flags short-term oversold and the Stochastic is closing in. The ground for a technical bounce is there; the confirmation isn’t. One more thing worth noting: the correlation with the dollar is +0.69, so the index is moving with the greenback, not against it.
🏛️ Pretore signature for the week:
- Mon:
active short→ Fri:active short— Δ unchanged - Operational stop, Friday close: 7,799.4451
🧭 Asset Compass ($SPX) · Friday close, October 23, 2026
  VERDICT           CONTESTED        — recent momentum neutral
  OPERATING REGIME  Moderate bull
  LINEARITY         Non-linear trends
  COHERENCE         NONE
  RELIABILITY       SUSPENDED
  POSITION          in band          — just below the underlying trend
  UNDERLYING TREND  Persistent bull  — solid
Quantitative reading of the asset’s regime: the short- and medium-term readings pull in opposite directions and the signal is scattered, so the Compass says wait, don’t bet on where it goes. The underlying trend stays bullish and solid. The fracture runs through the tactical picture, not the structural one, and it’s the same fracture the 4 TA layers show.
Detected Patterns
| Pattern | Status |
|---|---|
| Lower highs and lower lows since the October 6 high | ✅ Confirmed |
| Close below the SMA50 | ✅ Confirmed |
| Bearish MACD cross | ✅ Confirmed |
| Bearish Tenkan/Kijun cross | ✅ Confirmed |
| Short-term oversold (Williams %R) | ⚠️ Forming — no reversal signal |
📌 Operating Scenario
| Item | Description |
|---|---|
| Primary scenario | Orderly correction within the underlying uptrend, with price below the 7,700-7,727 band |
| Conditions | The 7,512-7,580 zone holds; no sustained recovery of the SMA50 |
| Key support | 7,612 (Friday’s low) → 7,512 (S1) → 7,373 (S2) / 7,291 (SMA200) |
| Key resistance | 7,647 (pivot) → 7,700-7,727 (SMA50, EMA20, Kijun) → 7,786 (R1) |
| Warning level | Close below 7,512: the correction extends toward S2 and the SMA200 |
| Estimated timing | 1-2 weeks |
BIAS: NEUTRAL-WEAK — Bullish underlying structure, short term in the sellers’ hands. Above 7,727 the correction unwinds; below 7,512 it deepens.
🎯 FINBEAR Verdict
Direction: 🟡 Underlying bull, short term correcting
| Scenario | Trigger | Target | Note |
|---|---|---|---|
| ▶▶▶ CENTRAL THESIS — Orderly correction | 7,512 holds with price below 7,727 | Range 7,512 – 7,713 | −DI dominant, MACD negative, short-term oversold |
| ▶▶ ALTERNATIVE SCENARIO — Recovery | Close above 7,727 (SMA50/Kijun) | 7,786 (R1) → ~7,850 (October high) | Needs the SAR to flip below price and flows to turn positive |
| ▶ TAIL SCENARIO — Extended correction | Close below 7,512 | 7,373 (S2) → 7,291 (SMA200) | Only if outflows accelerate |
📡 Operating levels, decision dashboard and summary verdict for this asset → CTM Signal™
📎 The S&P chart shows a bull that has lost its tactical average without losing its structure: the SMA200 far below and rising, but the short term belongs to the sellers. What the chart doesn’t say is why the index is moving with the dollar, or who is selling the tech leaders. This week’s story lives in the RADAR Pro Elite editions. Anyone reading “above the 200” as “no risk” is staring at the floor while the ceiling comes down.
📈 Technical Charts — $SPX
Section produced for Module C — FINBEAR™ Strategic Report — October 24, 2026
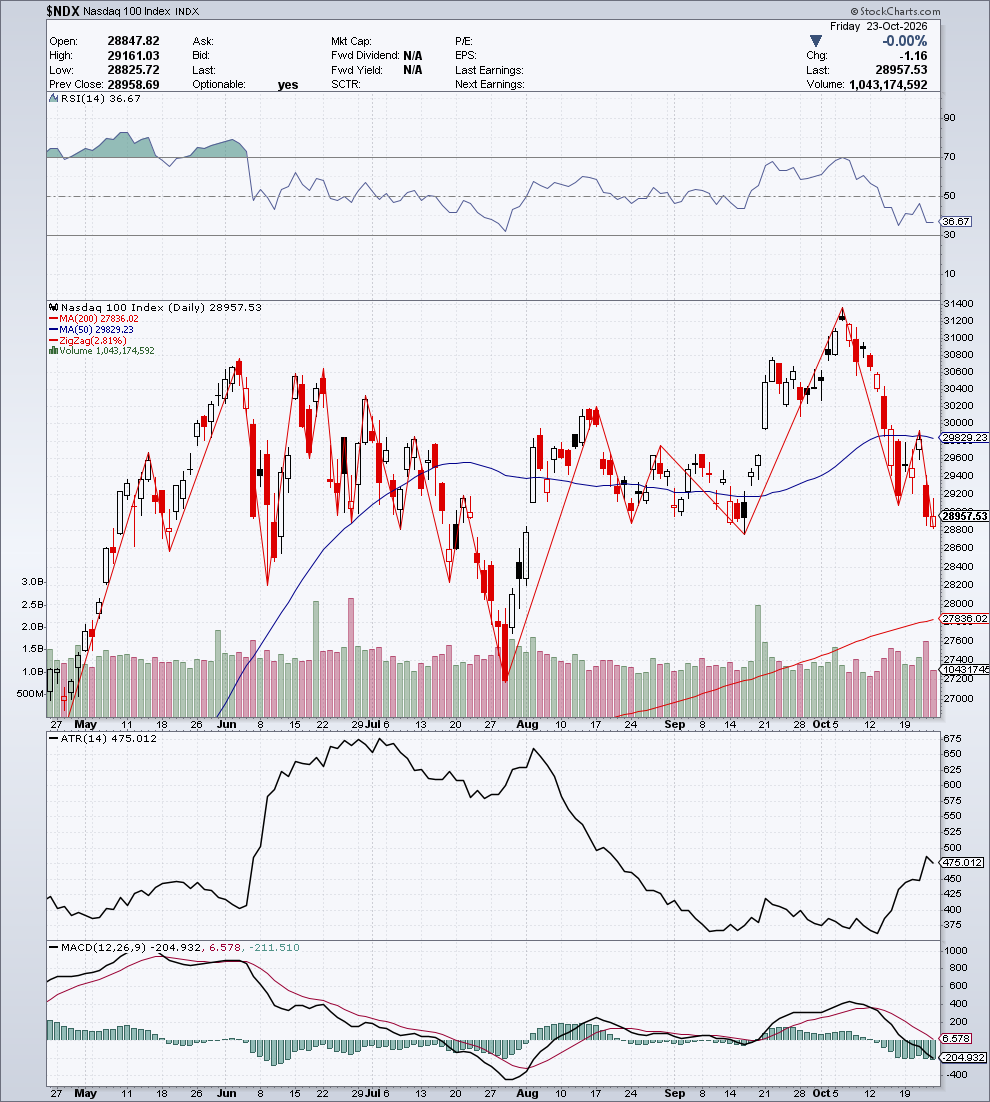
📊 Nasdaq 100 ($NDX) — 28,957.53
Date: Friday, October 23, 2026 | Change: −1.16 (unchanged) | Volume: 1.04bn
Daily range: 28,825.72 – 29,161.03 | Prev. Close: 28,958.69
Indicator Table
| Indicator | Value | Signal | Notes |
|---|---|---|---|
| Trend | Short-term correction within an underlying uptrend | 🔴 | Below SMA50 and EMA20, above SMA200; lower lows and lower highs since October 6 |
| SMA 200 | 27,836.02 | Below price | +4.03% |
| SMA 50 | 29,829.23 | Above price | −2.92% |
| Zig Zag (2.81%) | Oct 6 high ~31,300 → Oct 15 low → Oct 20 bounce → new low 28,826 | 🔴 | Bearish sequence |
| RSI (14) | 36.67 | 🟠 | Weak, close to oversold territory |
| MACD (12,26,9) | −204.93 / 6.58 | 🔴 | Histogram −211.51; line below the signal and below zero |
| ATR (14) | 475.01 | ↑ | Volatility expanding sharply since mid-October |
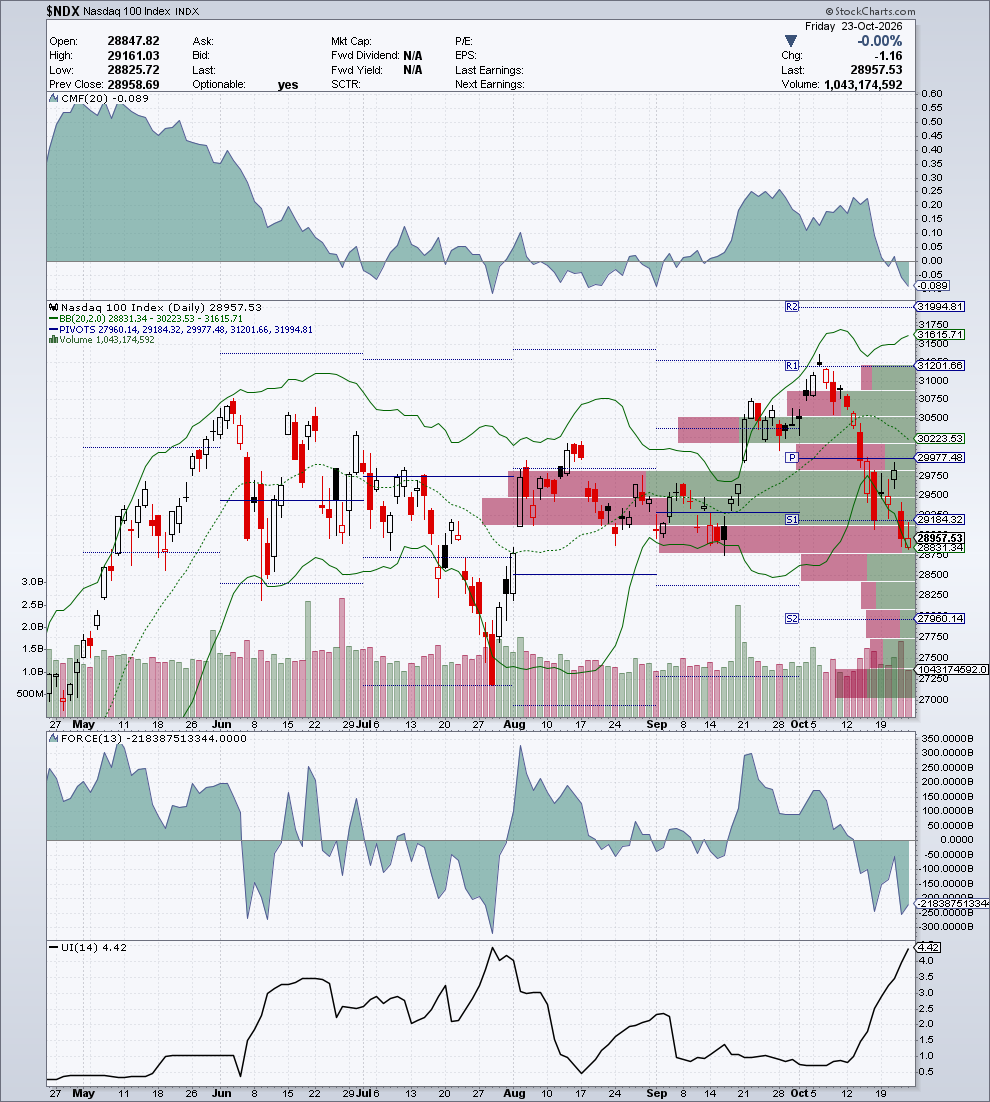
| Bollinger (20,2) | 28,831.34 / 30,223.53 / 31,615.71 | lower band | Price on the lower band, bands widening |
| Pivot Points | S2 27,960.14 · S1 29,184.32 · P 29,977.48 · R1 31,201.66 · R2 31,994.81 | below S1 | Close below the first pivot support |
| Volume by Price | cluster at 28,800-29,900 | — | Price on the lower edge of the trading zone |
| CMF (20) | −0.089 | 🔴 | Net outflow |
| Force Index (13) | −218.39bn | 🔴 | Heavy selling pressure |
| Ulcer Index (14) | 4.42 | medium-high, rising sharply | Drawdown widening |
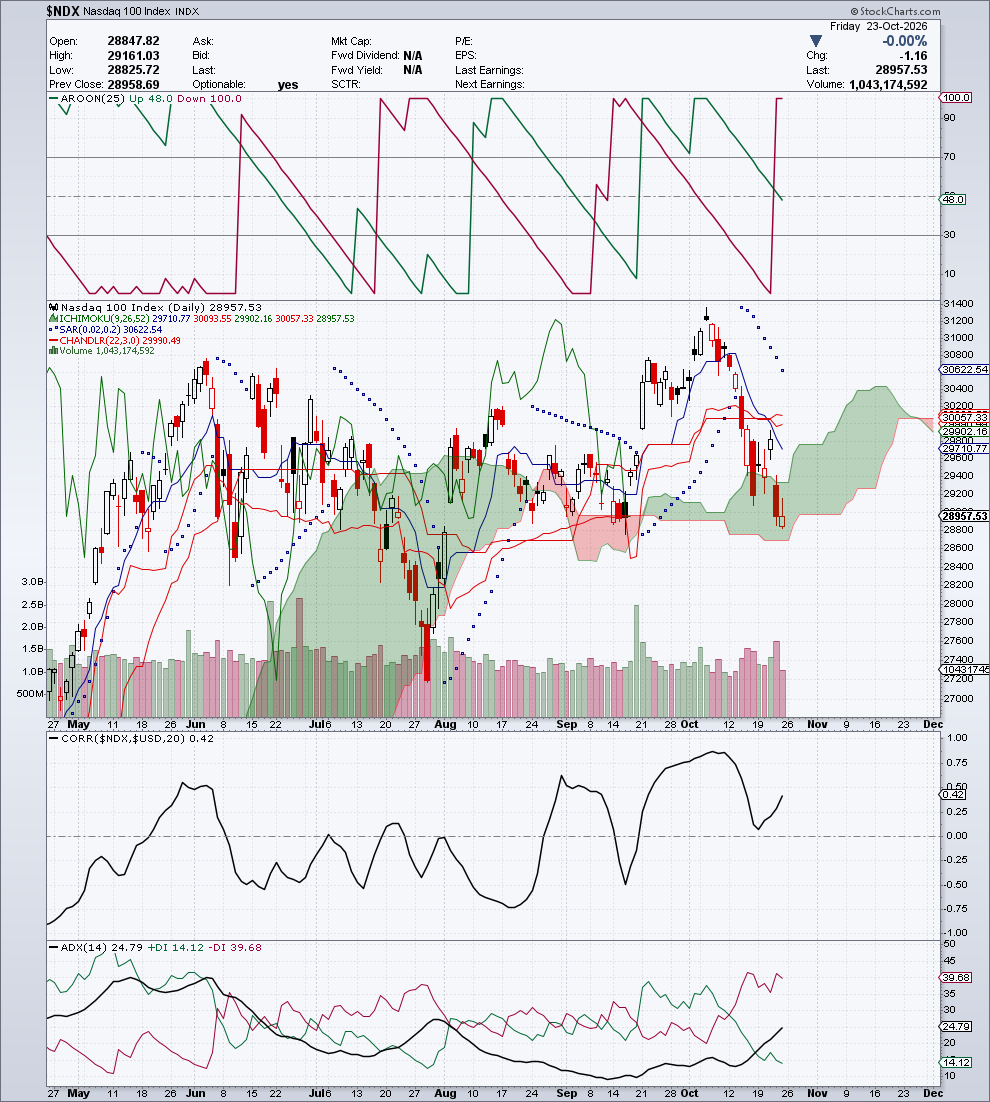
| Ichimoku Full | 29,710.77 / 30,093.55 / 29,902.16 / 30,057.33 | 🔴 | Price pressing on the lower edge of the Kumo; Tenkan below Kijun; cloud projected above |
| Parabolic SAR | 30,622.54 | 🔴 | Above price (+5.75%) |
| Chandelier Exit (22,3) | 29,990.49 | 🔴 | Price below the exit level for long positions |
| Aroon (25) | Up 48 / Down 100 | 🔴 | New 25-session low |
| Correlation vs $USD (20) | +0.42 | + | Direct, moderate |
| ADX (14) | 24.79 (+DI 14.12 / −DI 39.68) | 🔴 | ADX rising toward 25, −DI nearly three times +DI |
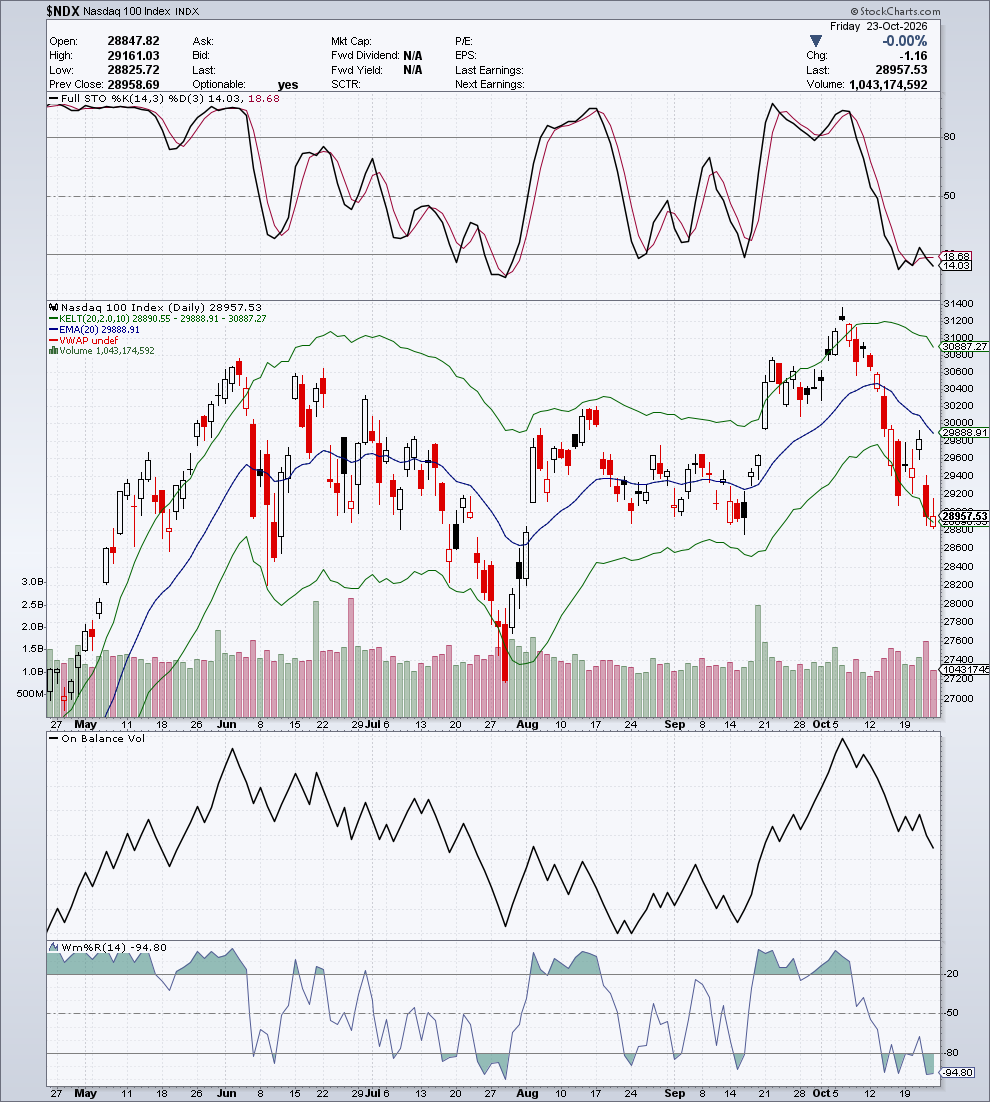
| Keltner Channels (20,2,10) | 28,890.55 / 29,888.91 / 30,887.27 | lower band | Price just above the lower band |
| EMA (20) | 29,888.91 | Above price | −3.12% |
| VWAP | n/a | — | Not available on the index |
| Stochastic (14,3,3) | 14.03 / 18.68 | 🟠 | Oversold |
| OBV | falling | 🔴 | Sharp decline from the early-October peak |
| Williams %R (14) | −94.80 | 🟠 | Oversold |
Analytical Commentary
Quantitative frame. The Nasdaq 100’s Compass records recent momentum confirming a strongly bearish operating regime in the short term, with the medium term still positive and the underlying trend bullish and solid. That’s the textbook definition of a tactical correction inside a bull. All 4 layers confirm it: the seller controls the short term, and the long-term structure isn’t in question.
Candlestick. On Friday the Nasdaq 100 closed unchanged (−1.16 points) with a small body and a long upper shadow. The bounce attempt up to 29,161 was turned away and the close sank back to 28,957. It’s classic behavior for a market where every rally finds a seller waiting.
Moving Averages. Price is below the SMA50 (29,829, −2.92%) and below the EMA20 (29,889), which is falling. The SMA200 (27,836) is still +4.03% away and rising. The gap between price and the long average is the room the correction has left to run. For now the structure holds, but the distance shrinks session after session.
Ichimoku Kinko Hyo. Price is pressing on the lower edge of the cloud, with the Tenkan (29,711) below the Kijun (30,094): a short-term bearish cross. The SAR is above price at 30,622, and the Chandelier at 29,990 has been lost: three exit signals for longs, all lined up.
Bands & Levels. The close sits on the lower Bollinger band and just above the lower Keltner, with the bands widening — volatility is riding along with the decline. Price has also lost the first pivot support (S1 29,184). Immediate support is the 28,900 zone, tested several times over the past year; below that sits 28,553, then S2 at 27,960 and the SMA200.
Oscillators & Flows. Here the picture is clear-cut: ADX rising to 24.8 with −DI (39.7) nearly three times +DI (14.1), Aroon Down at 100 (a new 25-session low), MACD below zero with the histogram widening. Flows are heading for the exit: CMF at −0.089, Force Index at −218bn, OBV sliding from its early-October peak. The Stochastic at 14 and Williams %R at −95 are oversold. There’s room for a technical bounce, but the expanding ATR says it would be a bounce inside the storm, not the end of it. Compared with the broader Nasdaq, the bearish signal is sharper among the hundred leaders.
🏛️ Pretore signature for the week:
- Mon:
active short→ Fri:active short— Δ unchanged - Operational stop, Friday close: 29,190.3472
🧭 Asset Compass ($NDX) · Friday close, October 23, 2026
  VERDICT           CONFIRMED        — recent momentum confirms
  OPERATING REGIME  STRONG BEAR
  LINEARITY         Ordinary trends
  COHERENCE         NONE
  RELIABILITY       MEDIUM
  POSITION          -- below trend   — below the underlying trend
  UNDERLYING TREND  Persistent bull  — solid
Quantitative reading of the asset’s regime: the short term has deteriorated while the medium term stays positive: a tactical correction inside a solid underlying uptrend, not the end of a cycle. Medium reliability means the operating-regime reading should be taken with caution. The 4 TA layers describe exactly this correction.
Detected Patterns
| Pattern | Status |
|---|---|
| Lower highs and lower lows since the October 6 high | ✅ Confirmed |
| Close below SMA50 and pivot S1 | ✅ Confirmed |
| Bearish Tenkan/Kijun cross | ✅ Confirmed |
| Bounce rejected (candle with long upper shadow) | ✅ Confirmed |
| Short-term oversold (Stochastic, Williams %R) | ⚠️ Forming — no reversal signal |
📌 Operating Scenario
| Item | Description |
|---|---|
| Primary scenario | Correction continuing toward the 28,550 – SMA200 zone |
| Conditions | Price below 29,190 (pivot S1 and first resistance); −DI dominant |
| Key support | 28,826 (low) → 28,553 → 27,960 (S2) / 27,836 (SMA200) |
| Key resistance | 29,184-29,190 → 29,829-29,889 (SMA50, EMA20) → 29,977 (pivot) |
| Warning level | Close below 27,836: the correction turns into a break of the long-term structure |
| Estimated timing | 1-2 weeks |
BIAS: BEARISH — Bearish in the short term, inside an underlying trend that stays bullish. Above 29,190 a technical bounce opens up; below the SMA200 the picture changes.
🎯 FINBEAR Verdict
Direction: 🔴 Correction under way
| Scenario | Trigger | Target | Note |
|---|---|---|---|
| ▶▶▶ CENTRAL THESIS — Correction toward the SMA200 | Price below 29,190 | 28,553 → 27,960 / 27,836 | ADX rising, −DI nearly triple +DI, flows heading out |
| ▶▶ ALTERNATIVE SCENARIO — Oversold bounce | Close above 29,190 | 29,830 – 29,977 (SMA50, pivot) | The bounce runs into the ceiling of the averages |
| ▶ TAIL SCENARIO — Structural break | Close below 27,836 | 26,174 (next support) | Needs outflows to accelerate |
📡 Operating levels, decision dashboard and summary verdict for this asset → CTM Signal™
📎 The Nasdaq 100 chart says the hundred leaders are correcting harder than the broader market, and that every bounce gets sold. It doesn’t say who is selling, or whether this is rotation or a flight from the artificial-intelligence trade. That story lives in this week’s RADAR Pro Elite editions. Price shows the wound; to know who held the knife, you have to read the facts.
📈 Technical Charts — $NDX
Section produced for Module C — FINBEAR™ Strategic Report — October 24, 2026
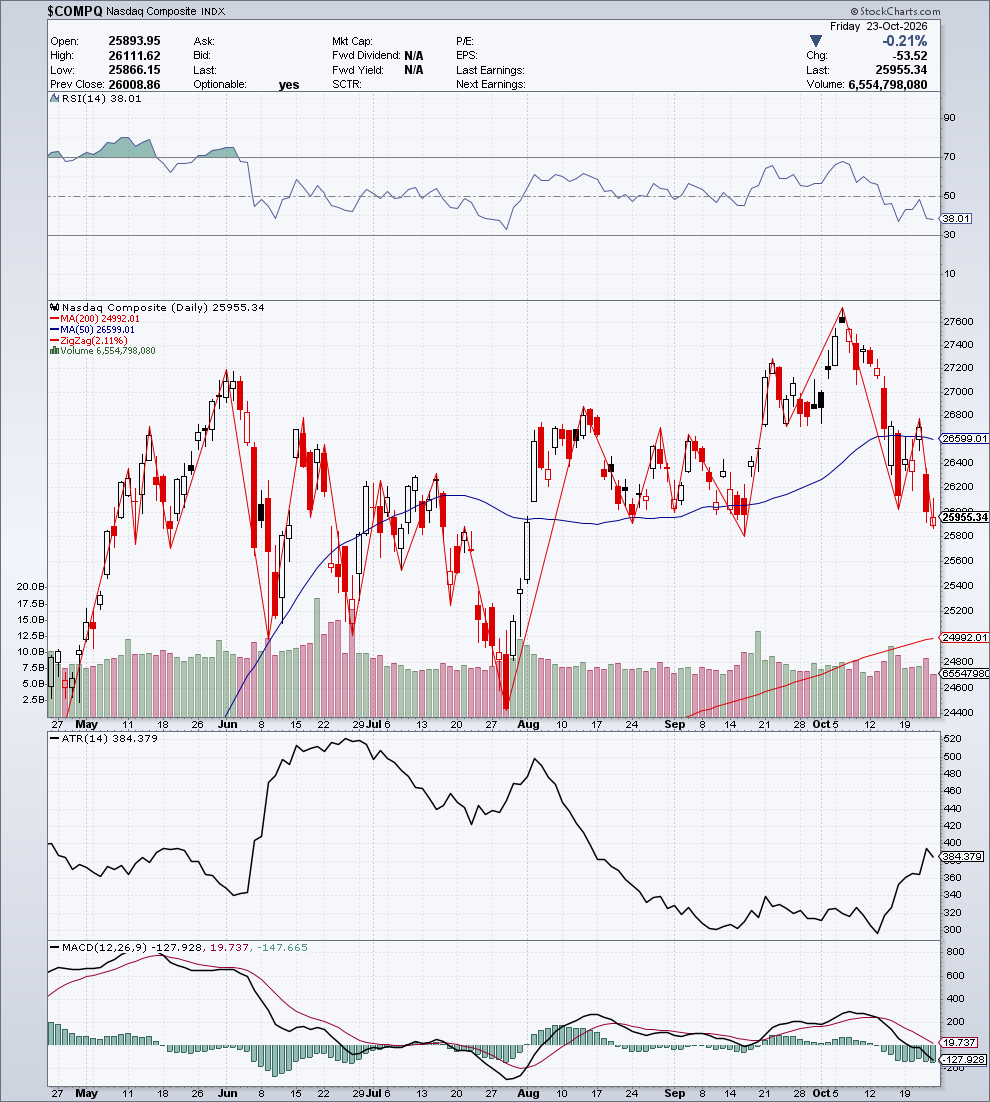
📊 Nasdaq Composite ($COMPQ) — 25,955.34
Date: Friday, October 23, 2026 | Change: −53.52 (−0.21%) | Volume: 6.55bn
Daily range: 25,866.15 – 26,111.62 | Prev. Close: 26,008.86
Indicator Table
| Indicator | Value | Signal | Notes |
|---|---|---|---|
| Trend | Short-term correction within an underlying uptrend | 🔴 | Below SMA50 and EMA20, above SMA200 |
| SMA 200 | 24,992.01 | Below price | +3.85% |
| SMA 50 | 26,599.01 | Above price | −2.42% |
| Zig Zag (2.11%) | Oct 6 high ~27,700 → Oct 15 low → Oct 20 bounce → new low 25,866 | 🔴 | Bearish sequence |
| RSI (14) | 38.01 | 🟠 | Weak |
| MACD (12,26,9) | −127.93 / 19.74 | 🔴 | Histogram −147.67; line below the signal and below zero |
| ATR (14) | 384.38 | ↑ | Volatility expanding since mid-October |
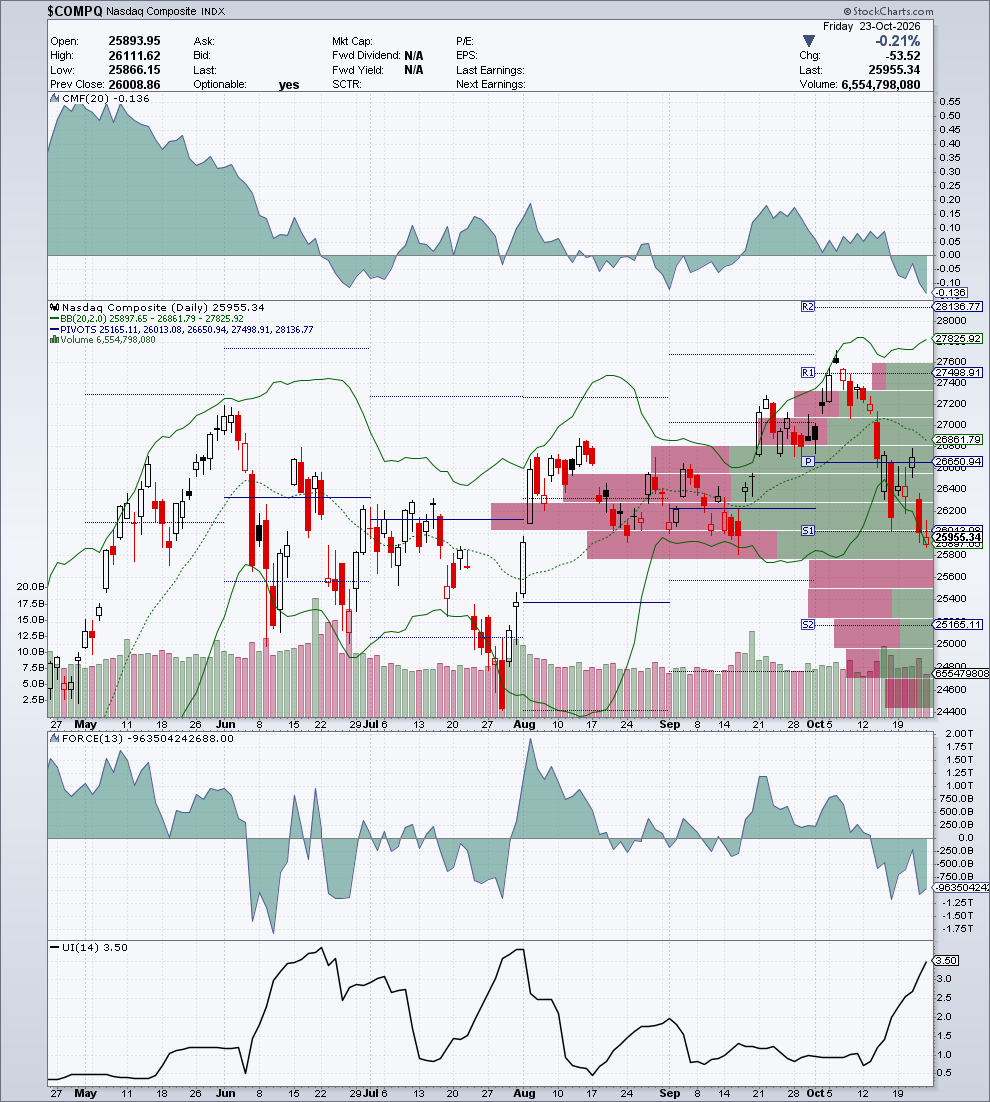
| Bollinger (20,2) | 25,897.65 / 26,861.79 / 27,825.92 | lower band | Price hugging the lower band |
| Pivot Points | S2 25,165.11 · S1 26,013.08 · P 26,650.94 · R1 27,498.91 · R2 28,136.77 | below S1 | Close just below the first pivot support |
| Volume by Price | cluster at 25,800-26,600 | — | Price on the lower edge of the trading zone |
| CMF (20) | −0.136 | 🔴 | Heavy outflow, the deepest among the US indices |
| Force Index (13) | −963.50bn | 🔴 | Selling pressure |
| Ulcer Index (14) | 3.50 | medium, rising sharply | Drawdown widening |
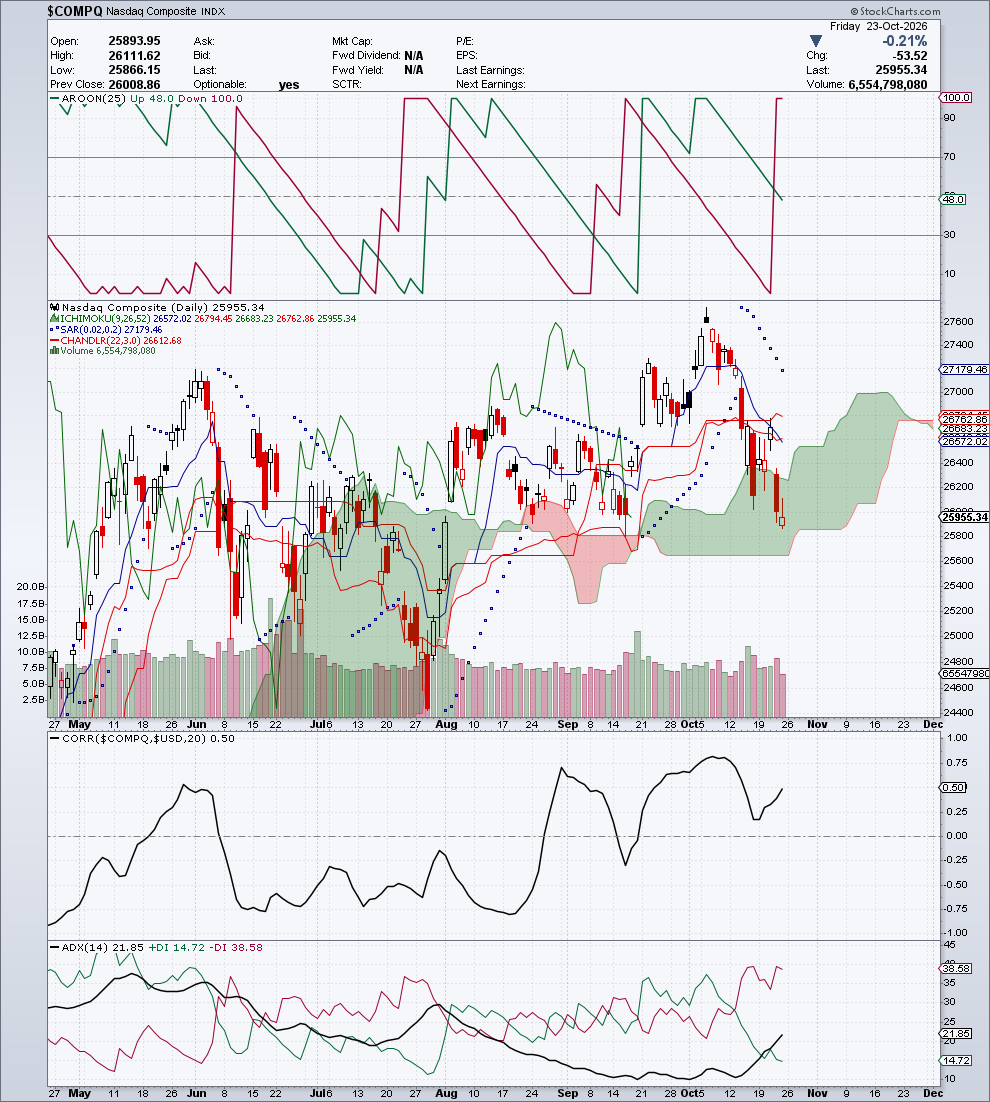
| Ichimoku Full | 26,572.02 / 26,794.45 / 26,683.23 / 26,762.86 | 🔴 | Price in the lower part of the Kumo; Tenkan below Kijun; cloud projected above |
| Parabolic SAR | 27,179.46 | 🔴 | Above price (+4.72%) |
| Chandelier Exit (22,3) | 26,612.68 | 🔴 | Price below the exit level for long positions |
| Aroon (25) | Up 48 / Down 100 | 🔴 | New 25-session low |
| Correlation vs $USD (20) | +0.50 | + | Direct, moderate |
| ADX (14) | 21.85 (+DI 14.72 / −DI 38.58) | 🔴 | Downtrend forming, −DI dominant |
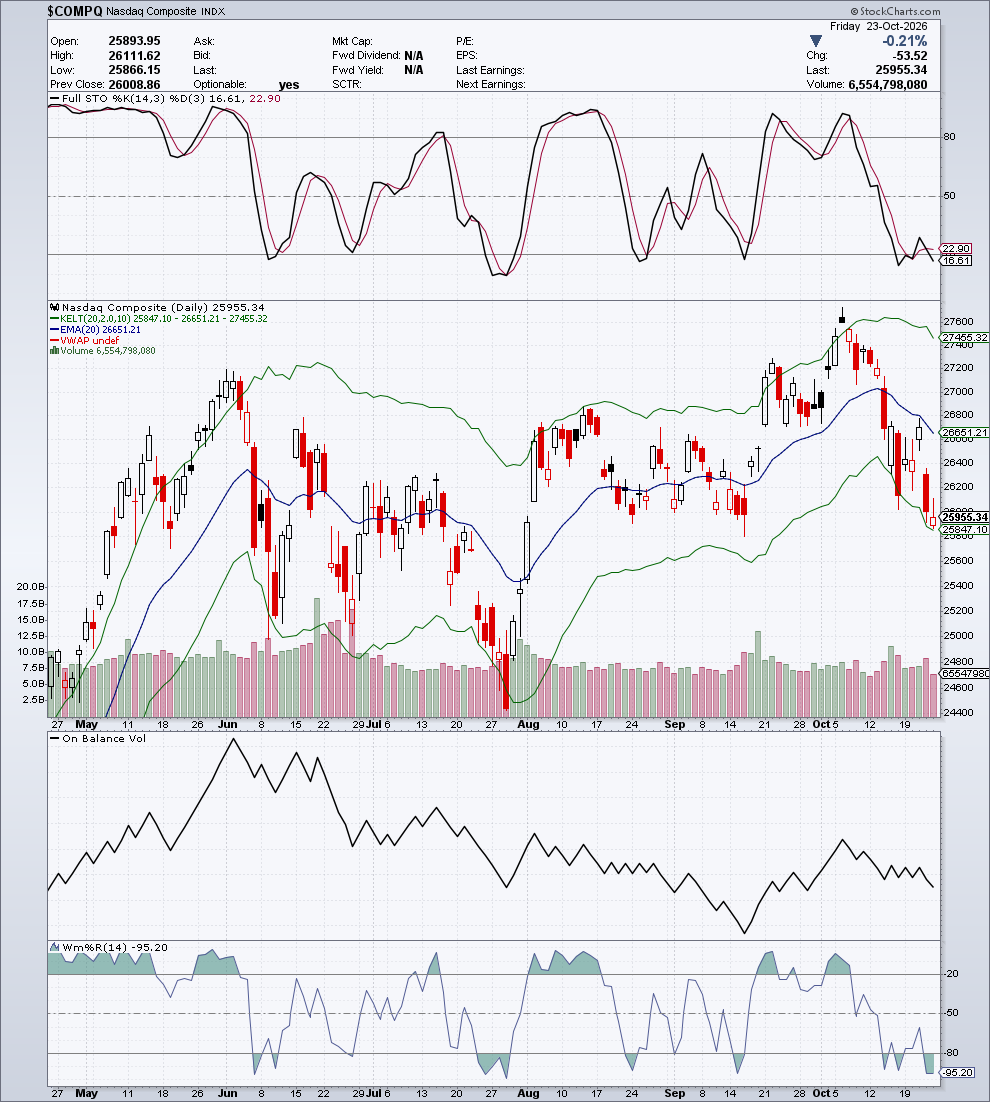
| Keltner Channels (20,2,10) | 25,847.10 / 26,651.21 / 27,455.32 | lower band | Price hugging the lower band |
| EMA (20) | 26,651.21 | Above price | −2.61% |
| VWAP | n/a | — | Not available on the index |
| Stochastic (14,3,3) | 16.61 / 22.90 | 🟠 | Oversold |
| OBV | moderate decline | 🔴 | Falling since early October, less steeply than on the Nasdaq 100 |
| Williams %R (14) | −95.20 | 🟠 | Oversold |
Analytical Commentary
Quantitative frame. The Composite’s Compass records recent momentum confirming a moderately bearish operating regime, with the short- and medium-term readings at odds and medium reliability; the underlying trend stays bullish and solid. Next to the Nasdaq 100, the quantitative reading measures a less violent correction, but the 4 layers are screening the same movie: the long-term structure is still standing, the short term is in the sellers’ hands.
Candlestick. Small body and an upper shadow: open at 25,894, a push up to 26,112, close at 25,955. Price finished above the open but below the previous close — the intraday bounce didn’t stick.
Moving Averages. Price is below the SMA50 (26,599, −2.42%) and below the EMA20 (26,651), which is falling. The SMA200 (24,992) is still +3.85% away. The underlying trend isn’t in question, but the margin is getting thinner.
Ichimoku Kinko Hyo. Price is in the lower part of the cloud, with the Tenkan (26,572) below the Kijun (26,794). The SAR is above price at 27,179 and the Chandelier (26,613) has been lost: the exit signal for short-term longs is confirmed by three tools.
Bands & Levels. The close is hugging the lower Bollinger and Keltner bands, just below the first pivot support (S1 26,013). The 25,950 zone, tested several times, is the support price is leaning on; below it sit 25,748, then S2 at 25,165 and the SMA200 at 24,992.
Oscillators & Flows. What sets the Composite apart is flows: CMF at −0.136, the deepest outflow among the panel’s US indices, with Force Index sharply negative. The ADX is at 21.9 and rising, with −DI (38.6) dominant, Aroon Down at 100 and the MACD below zero. The Stochastic and Williams %R (−95) are oversold. The conditions for a technical bounce are there; a reversal signal isn’t. The seller isn’t just hitting the leaders: the outflow runs through the entire index.
🏛️ Pretore signature for the week:
- Mon:
active short→ Fri:active short— Δ unchanged - Operational stop, Friday close: 26,299.2827
🧭 Asset Compass ($COMPQ) · Friday close, October 23, 2026
  VERDICT           CONFIRMED        — recent momentum confirms
  OPERATING REGIME  Moderate bear
  LINEARITY         Non-linear trends
  COHERENCE         NONE
  RELIABILITY       MEDIUM
  POSITION          -- below trend   — below the underlying trend
  UNDERLYING TREND  Persistent bull  — solid
Quantitative reading of the asset’s regime: the short term has deteriorated while the medium term stays positive: a tactical correction inside a solid underlying uptrend, not the end of a cycle. Medium reliability calls for caution. The quantitative reading captures the same correction the 4 layers describe, with less bearish momentum than the Nasdaq 100.
Detected Patterns
| Pattern | Status |
|---|---|
| Lower highs and lower lows since the October 6 high | ✅ Confirmed |
| Close below SMA50 and pivot S1 | ✅ Confirmed |
| Bearish Tenkan/Kijun cross | ✅ Confirmed |
| Short-term oversold (Stochastic, Williams %R) | ⚠️ Forming — no reversal signal |
📌 Operating Scenario
| Item | Description |
|---|---|
| Primary scenario | Correction continuing toward 25,750 – S2 |
| Conditions | Price below 26,299; flows negative |
| Key support | 25,866 (low) → 25,748 → 25,165 (S2) → 24,992 (SMA200) |
| Key resistance | 26,013 (S1) → 26,299 → 26,599-26,651 (SMA50, EMA20, pivot) |
| Warning level | Close below 24,992: break of the long-term structure |
| Estimated timing | 1-2 weeks |
BIAS: BEARISH — Bearish in the short term, inside an underlying uptrend. Above 26,299 a technical bounce opens up; below the SMA200 the picture changes.
🎯 FINBEAR Verdict
Direction: 🔴 Correction under way
| Scenario | Trigger | Target | Note |
|---|---|---|---|
| ▶▶▶ CENTRAL THESIS — Correction extending | Price below 26,299 | 25,748 → 25,165 (S2) | Heavy outflow, −DI dominant |
| ▶▶ ALTERNATIVE SCENARIO — Oversold bounce | Close above 26,299 | 26,599 – 26,651 (SMA50, EMA20, pivot) | The bounce runs into the ceiling of the averages |
| ▶ TAIL SCENARIO — Structural break | Close below 24,992 | 24,004 (next support) | Only if selling accelerates |
📡 Operating levels, decision dashboard and summary verdict for this asset → CTM Signal™
📎 The Composite confirms the correction isn’t just the leaders’ problem: the deepest outflow among the US indices runs right through the index. The chart doesn’t say whether this is profit-taking or a change of heart about risk. The week’s story lives in the RADAR Pro Elite editions. When the second string gets sold too, the market isn’t pruning a branch: it’s shaking the tree.
📈 Technical Charts — $COMPQ
Section produced for Module C — FINBEAR™ Strategic Report — October 24, 2026
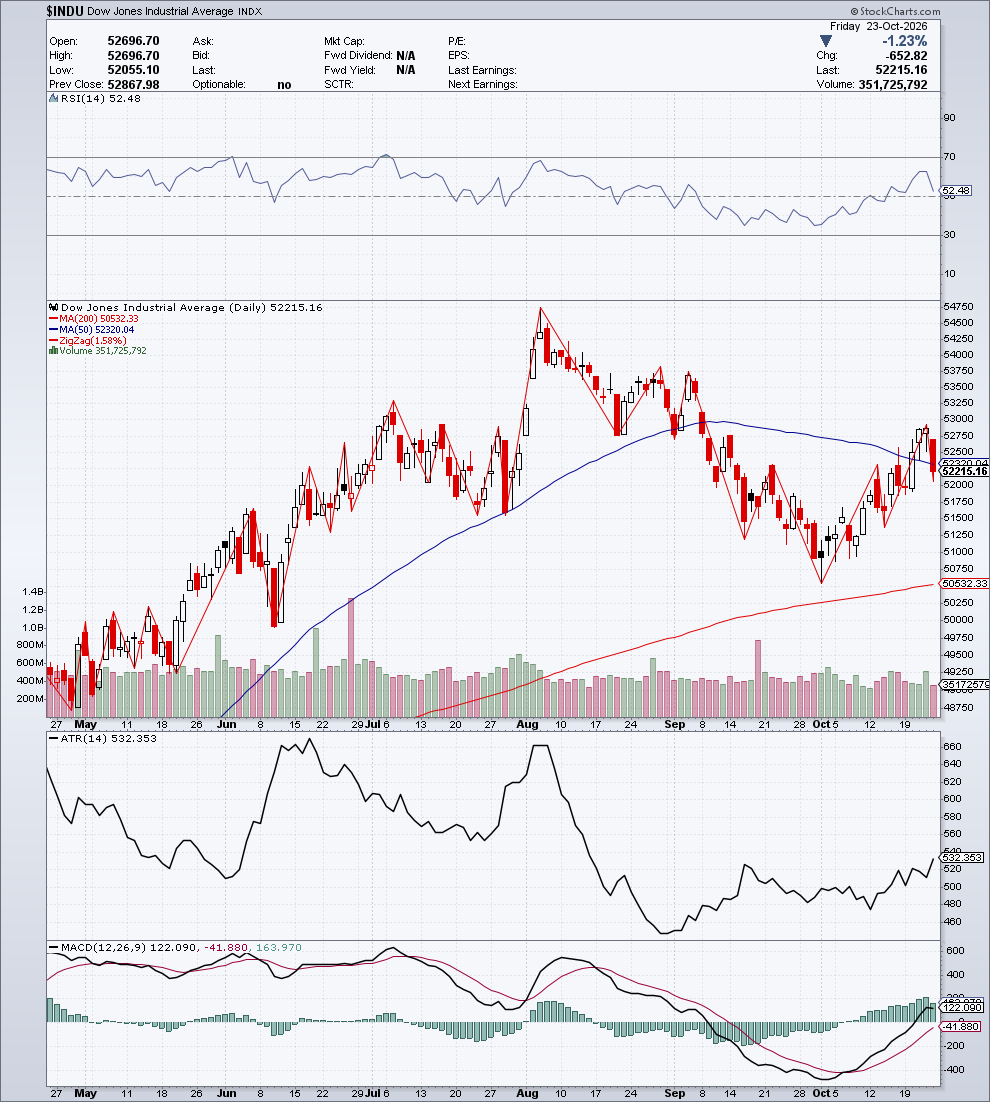
📊 Dow Jones Industrial ($INDU) — 52,215.16
Date: Friday, October 23, 2026 | Change: −652.82 (−1.23%) | Volume: 351.7M
Daily range: 52,055.10 – 52,696.70 | Prev. Close: 52,867.98
Indicator Table
| Indicator | Value | Signal | Notes |
|---|---|---|---|
| Trend | Recovery since early October, on pause | 🟡 | Price above EMA20 and SMA200, in contact with the SMA50 |
| SMA 200 | 50,532.33 | Below price | +3.33% |
| SMA 50 | 52,320.04 | Just above price | −0.20% — tactical average just lost |
| Zig Zag (1.58%) | Oct 1 low ~50,600 → higher lows → Oct 22 high → pullback | 🟢 | Bullish sequence from the October low |
| RSI (14) | 52.48 | ⚪ | Down from the 65 area into neutral territory |
| MACD (12,26,9) | 122.09 / −41.88 | 🟢 | Histogram +163.97; line above the signal and above zero |
| ATR (14) | 532.35 | ↑ | Rising |
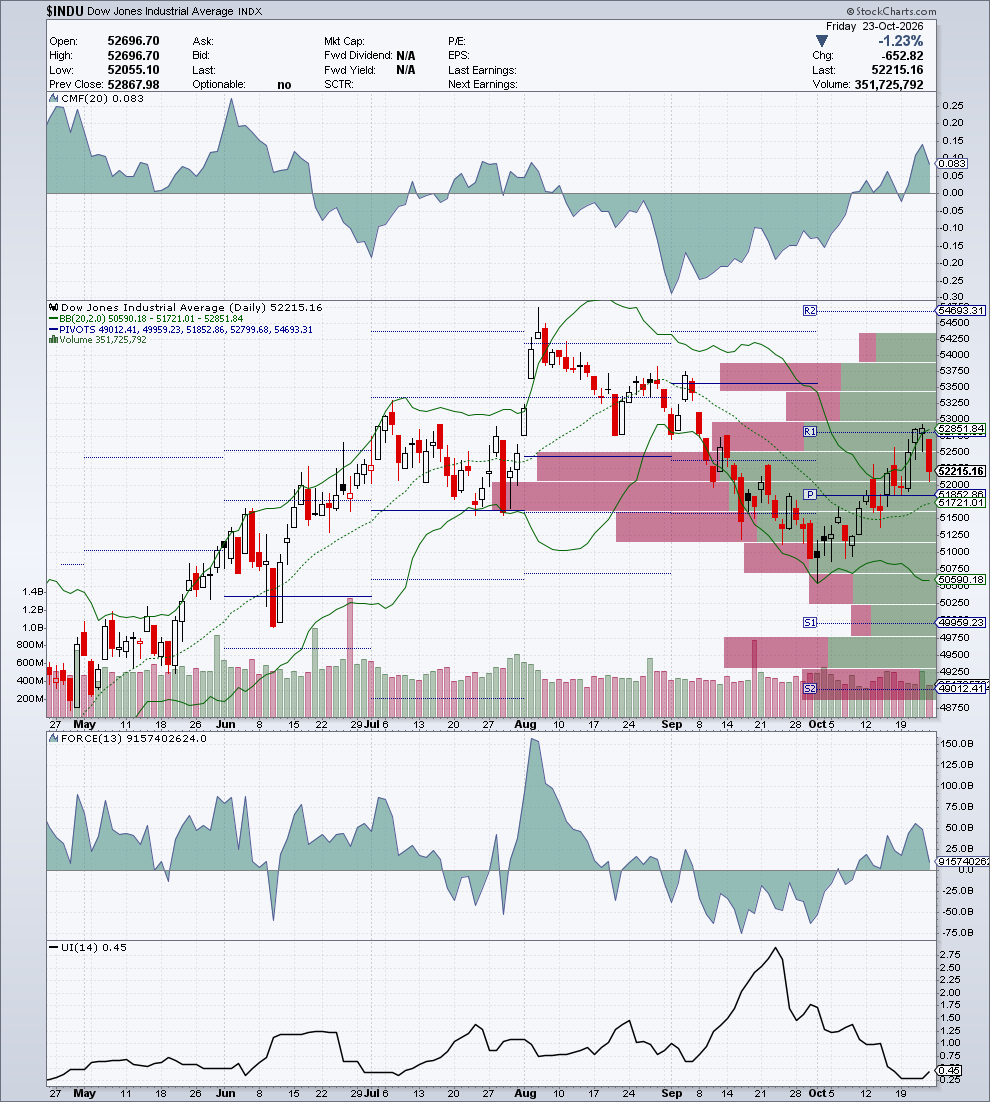
| Bollinger (20,2) | 50,590.18 / 51,721.01 / 52,851.84 | upper half | Turned back at the upper band |
| Pivot Points | S2 49,012.41 · S1 49,959.23 · P 51,852.86 · R1 52,799.68 · R2 54,693.31 | between P and R1 | Turned back just below R1 |
| Volume by Price | clusters at 51,500-52,500 and 53,250-54,250 | — | Price inside the main trading zone |
| CMF (20) | +0.083 | 🟢 | Inflow, easing from its mid-October peak |
| Force Index (13) | +9.16bn | 🟢 | Positive but falling |
| Ulcer Index (14) | 0.45 | very low | Minimal drawdown |
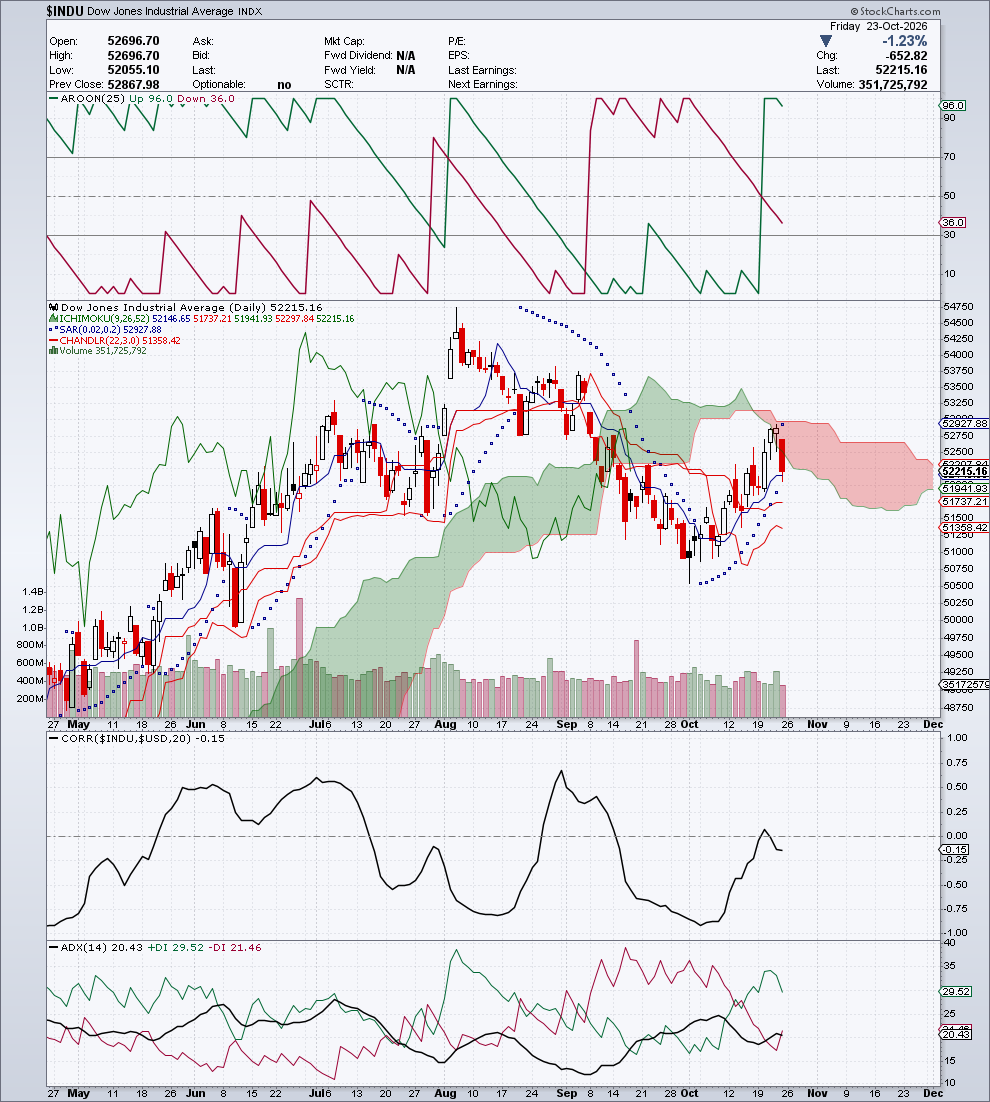
| Ichimoku Full | 52,146.65 / 51,737.21 / 51,941.93 / 52,297.84 | ⚪ | Close pressing on the lower edge of a bearish Kumo; Tenkan above Kijun, price above both |
| Parabolic SAR | 52,927.88 | 🔴 | Flipped above price with Friday’s session |
| Chandelier Exit (22,3) | 51,358.42 | 🟢 | Below price (−1.64%) |
| Aroon (25) | Up 96 / Down 36 | 🟢 | Recent high, Up dominant |
| Correlation vs $USD (20) | −0.15 | ≈ 0 | Negligible correlation |
| ADX (14) | 20.43 (+DI 29.52 / −DI 21.46) | 🟢 | Weak trend, still forming; +DI above −DI but closing in |
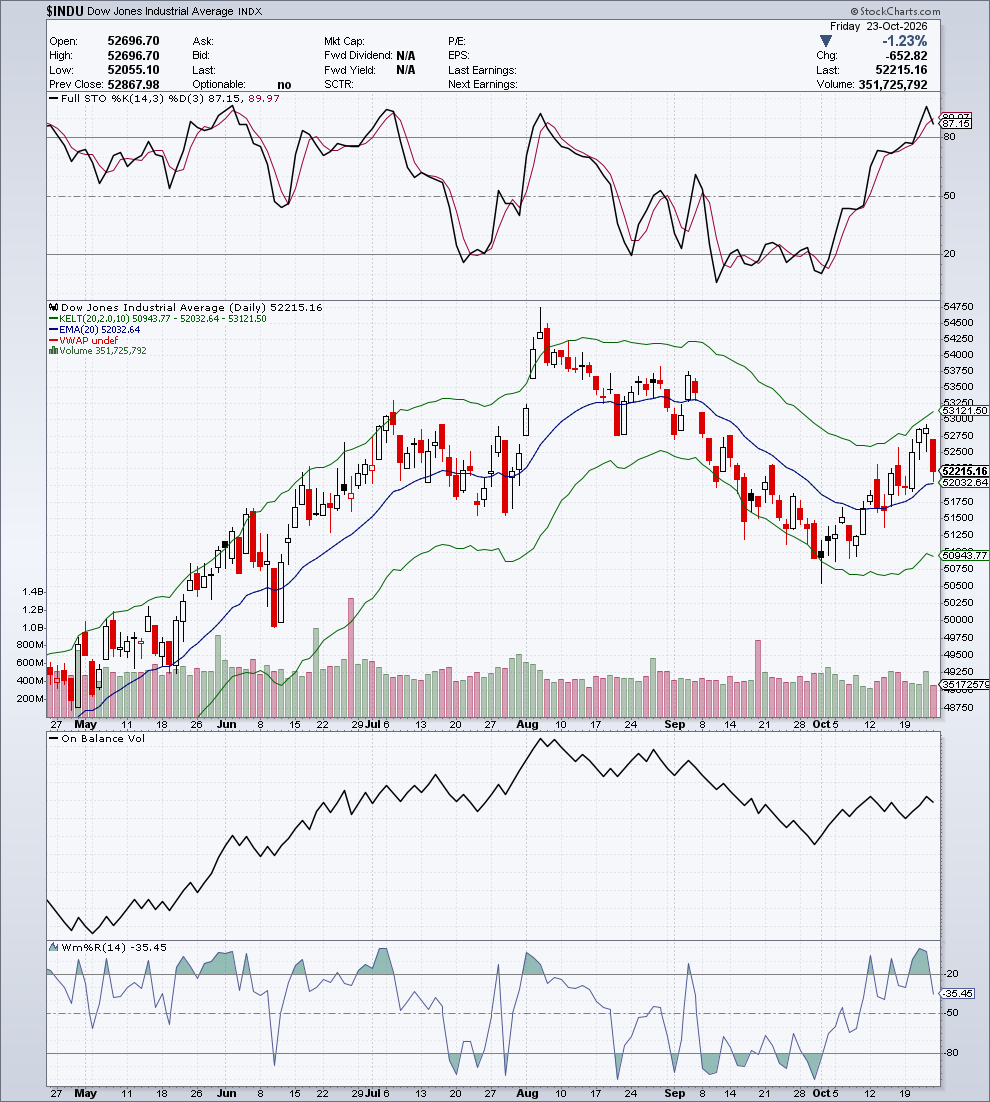
| Keltner Channels (20,2,10) | 50,943.77 / 52,032.64 / 53,121.50 | upper half | Above the channel midline |
| EMA (20) | 52,032.64 | Below price | +0.35% |
| VWAP | n/a | — | Not available on the index |
| Stochastic (14,3,3) | 87.15 / 89.97 | 🔴 | Overbought, %K below %D: bearish cross |
| OBV | sideways, slight uptick | ⚪ | No visible divergence |
| Williams %R (14) | −35.45 | ⚪ | Out of overbought |
Analytical Commentary
Quantitative frame. The Dow’s Compass records a moderately bullish operating regime, contested but with high reliability. The short term has turned up while the medium term stays weak. It’s the market’s first vote, not an established phase. The 4 layers confirm it: October’s recovery is real, and on Friday it tapped the brakes for the first time.
Candlestick. A full-bodied red candle that opened at the session high (52,697) and closed at 52,215, with the body covering three quarters of the range and no upper shadow — Friday’s biggest drop among the panel’s US indices (−1.23%). The seller seized the initiative at the open and never handed it back.
Moving Averages. Price is back in contact with the SMA50 (52,320), closing just below it (−0.20%), but it’s still above the EMA20 (52,033) and well above the SMA200 (50,532, +3.33%). The structure of the recovery from the October 1 low is intact; the 50-day is where it gets put to the test.
Ichimoku Kinko Hyo. The cloud is bearish and hangs just above price: October’s climb ran straight into its lower edge, and on Friday price was knocked back. The Tenkan (52,147) is above the Kijun (51,737) and price is above both. The short term stays constructive, but on Friday the SAR flipped above price (52,928) and the first exit signal has fired.
Bands & Levels. Price was turned back at the upper Bollinger band (52,852) and pivot R1 (52,800): that’s where the ceiling is. Below, the Bollinger midline (51,721) and the central pivot (51,853) form the first cushion; further down sit the 51,585 zone and the Chandelier at 51,358. Friday’s close is below the 52,819 zone, which had acted as support in the previous sessions.
Oscillators & Flows. It’s still the most constructive picture among the US indices: MACD above zero and above its signal, +DI (29.5) over −DI (21.5), Aroon Up at 96, positive CMF (+0.083), Ulcer Index at its lows (0.45). But the fast oscillators are rolling over: Stochastic overbought with %K below %D, Williams %R out of the top zone, CMF and Force Index off their peaks. The Dow is the only US index on the panel with positive flows. The rotation into the old guard is holding, but on Friday it stopped to catch its breath.
🏛️ Pretore signature for the week:
- Mon:
active long→ Fri:active long— Δ unchanged - Operational stop, Friday close: 51,584.5456
🧭 Asset Compass ($INDU) · Friday close, October 23, 2026
  VERDICT           CONTESTED        — recent momentum neutral
  OPERATING REGIME  Moderate bull
  LINEARITY         Ordinary trends
  COHERENCE         NONE
  RELIABILITY       HIGH
  POSITION          in band          — just below the underlying trend
  UNDERLYING TREND  Persistent bull  — solid
Quantitative reading of the asset’s regime: the short term has turned up while the medium term stays weak, so the regime is contested; it’s the market’s first vote, not yet an established phase. High reliability and a solid underlying trend: the quantitative reading measures a young recovery, the same one the 4 TA layers describe.
Detected Patterns
| Pattern | Status |
|---|---|
| Higher lows since the October 1 low | ✅ Confirmed |
| Rejection at the upper Bollinger band and pivot R1 | ✅ Confirmed |
| SAR flipped above price | ✅ Confirmed |
| Bearish Stochastic cross in overbought | ✅ Confirmed |
📌 Operating Scenario
| Item | Description |
|---|---|
| Primary scenario | Recovery on pause, with the 51,720-51,850 area holding |
| Conditions | No close below 51,585; flows stay positive |
| Key support | 52,033 (EMA20) → 51,721-51,853 (Bollinger midline, pivot) → 51,585 → 51,358 (Chandelier) |
| Key resistance | 52,320 (SMA50) → 52,800-52,852 (R1, upper Bollinger) → 52,928 (SAR) → 53,783 |
| Warning level | Close below 51,585: price retraces October’s recovery toward the SMA200 |
| Estimated timing | 1-2 weeks |
BIAS: NEUTRAL-POSITIVE — A constructive recovery on pause. Losing the 52,819 zone, which had acted as support, is the braking signal to watch; below 51,585, which is also where the bullish signature’s invalidation level sits, the pause turns into a correction.
🎯 FINBEAR Verdict
Direction: 🟡 Recovery on pause
| Scenario | Trigger | Target | Note |
|---|---|---|---|
| ▶▶▶ CENTRAL THESIS — Pause and retest | 51,721-51,853 holds | 52,800 – 52,852 (R1, upper Bollinger) | MACD positive, +DI on top, flows coming in |
| ▶▶ ALTERNATIVE SCENARIO — Correction toward the SMA200 | Close below 51,585 | 50,590 (lower Bollinger) → 50,532 (SMA200) | SAR flipped, Stochastic leaving overbought |
| ▶ TAIL SCENARIO — Rally resumes | Close above 52,928 (SAR) | 53,783 (resistance) | Needs a break through the edge of the cloud |
📡 Operating levels, decision dashboard and summary verdict for this asset → CTM Signal™
📎 The Dow is the only US index with flows on the buyers’ side, and on Friday it took the biggest hit in the group: the old guard is holding, but it isn’t immune. The chart doesn’t say whether the rotation into industrials and cyclicals can survive a market that’s dumping tech. That story lives in the RADAR Pro Elite editions. If you’re taking shelter in the Dow, remember that shelters have doors too.
📈 Technical Charts — $INDU
Section produced for Module C — FINBEAR™ Strategic Report — October 24, 2026
📊 Philadelphia Semiconductor ($SOX) — 10,779.46
Date: Friday, October 23, 2026 | Change: +47.49 (+0.44%) | Volume: n/a (index)
Daily range: 10,667.92 – 10,923.18 | Prev. Close: 10,731.98
Indicator Table
| Indicator | Value | Signal | Notes |
|---|---|---|---|
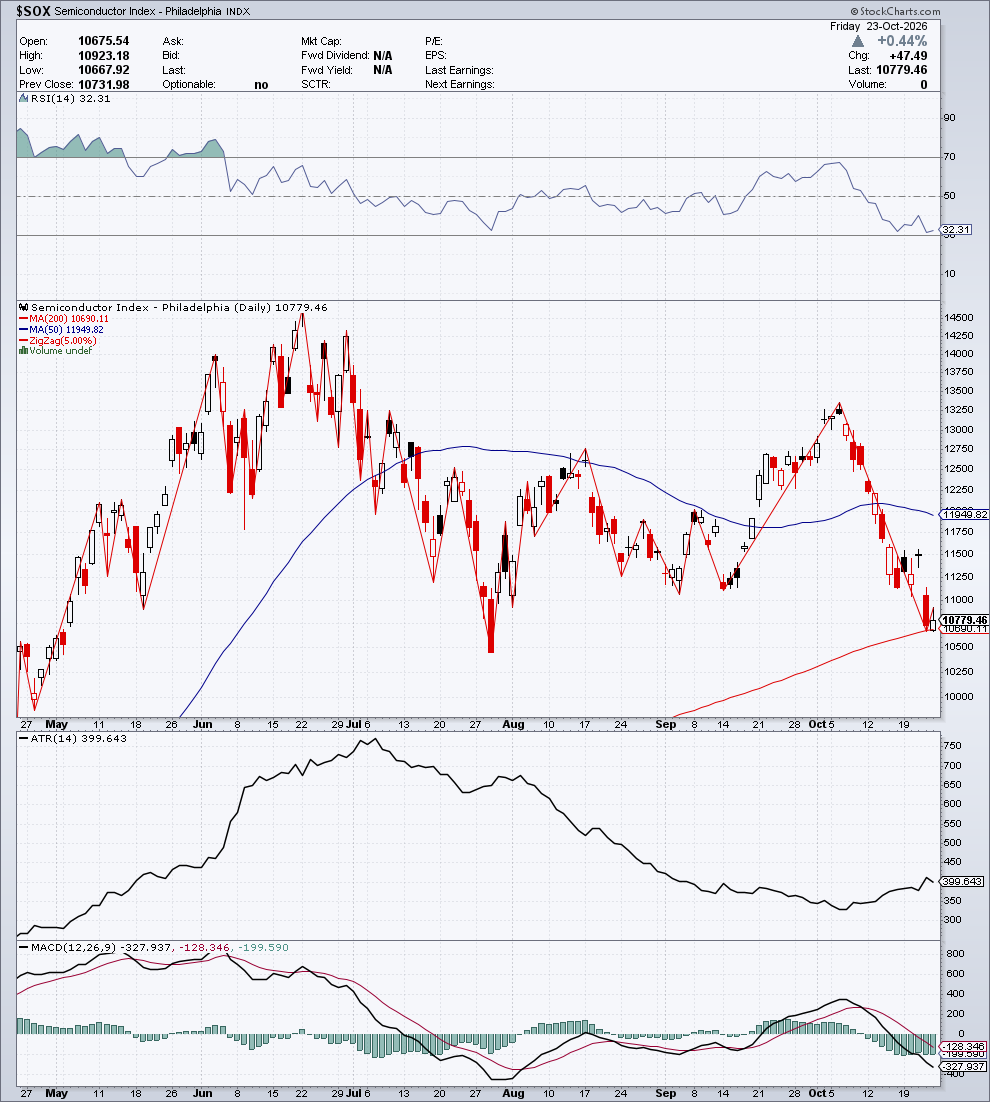
| Trend | Vertical drop all the way to the SMA200 | 🔴 | Price −9.79% below the SMA50, +0.84% above the SMA200 |
| SMA 200 | 10,690.11 | Below price | +0.84% — test under way |
| SMA 50 | 11,949.82 | Above price | −9.79% |
| Zig Zag (5.00%) | Oct 6 high ~13,300 → low 10,668 (Oct 23) | 🔴 | A single bearish wave, no meaningful intermediate bounces |
| RSI (14) | 32.31 | 🟠 | Brushing oversold |
| MACD (12,26,9) | −327.94 / −128.35 | 🔴 | Histogram −199.59; line below the signal and below zero |
| ATR (14) | 399.64 | ↑ | Edging higher |
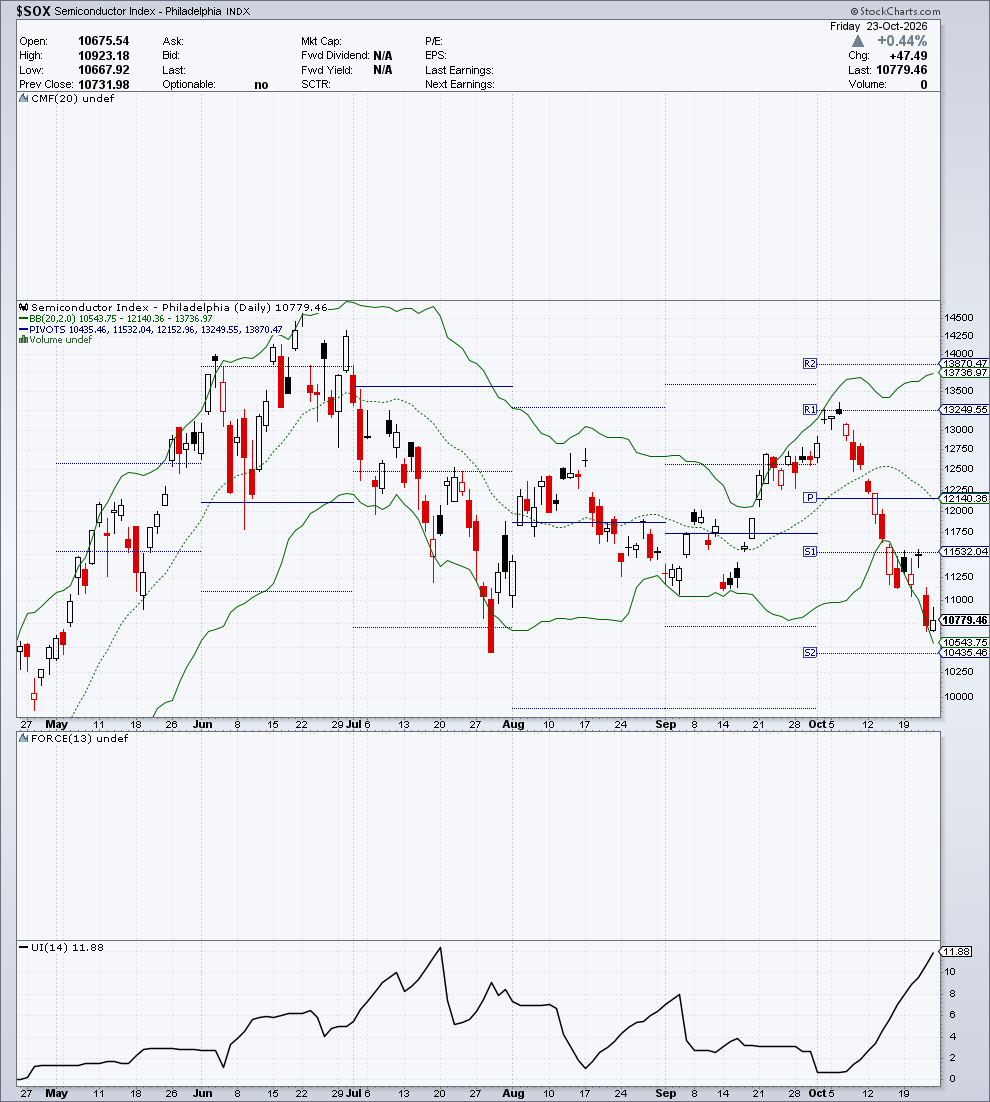
| Bollinger (20,2) | 10,543.75 / 12,140.36 / 13,736.97 | lower band | Price hugging the lower band, bands very wide |
| Pivot Points | S2 10,435.46 · S1 11,532.04 · P 12,152.96 · R1 13,249.55 · R2 13,870.47 | between S2 and S1 | Closer to S2 |
| Volume by Price | n/a | — | Index has no volume |
| CMF (20) | n/a | — | Index has no volume |
| Force Index (13) | n/a | — | Index has no volume |
| Ulcer Index (14) | 11.88 | high | Drawdown near its highest levels in the period shown, comparable to July |
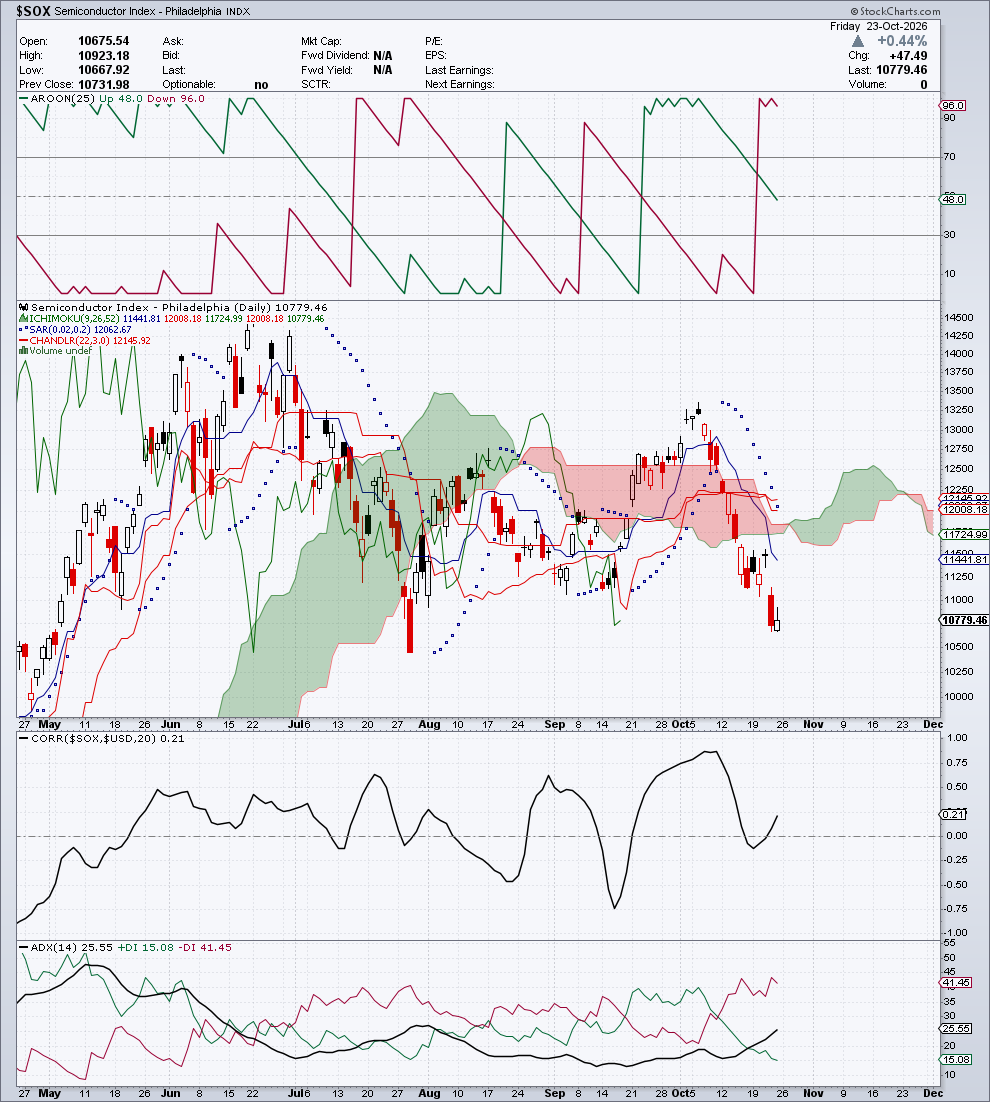
| Ichimoku Full | 11,441.81 / 12,008.18 / 11,724.99 / 12,008.18 | 🔴 | Price well below the Kumo; Tenkan below Kijun |
| Parabolic SAR | 12,062.67 | 🔴 | Above price (+11.90%) |
| Chandelier Exit (22,3) | 12,145.92 | 🔴 | Far above price |
| Aroon (25) | Up 48 / Down 96 | 🔴 | Recent lows, Down dominant |
| Correlation vs $USD (20) | +0.21 | ≈ 0 | Weak |
| ADX (14) | 25.55 (+DI 15.08 / −DI 41.45) | 🔴 | Downtrend confirmed, −DI nearly triple |
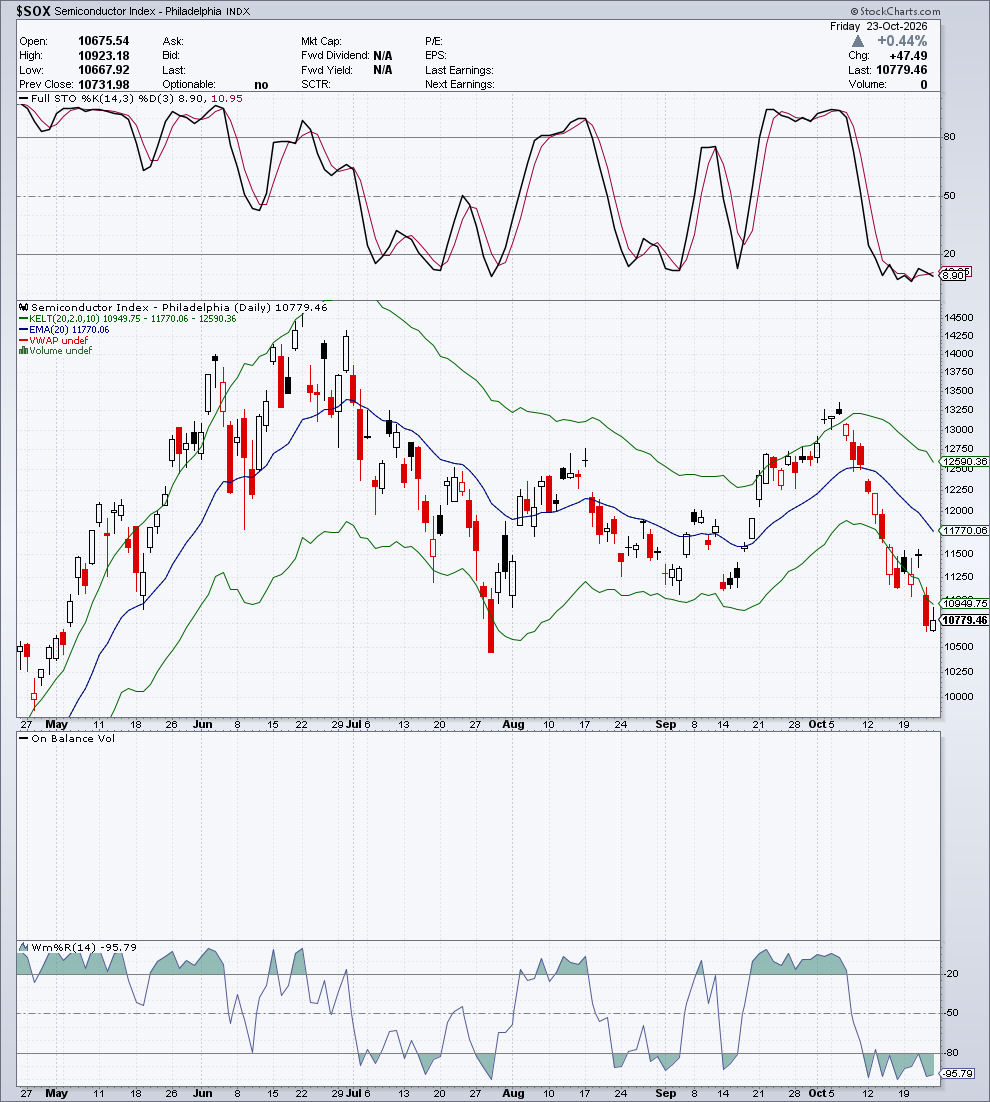
| Keltner Channels (20,2,10) | 10,949.75 / 11,770.06 / 12,590.36 | below the lower band | Price walking outside the channel |
| EMA (20) | 11,770.06 | Above price | −8.42% |
| VWAP | n/a | — | Not available on the index |
| Stochastic (14,3,3) | 8.90 / 10.95 | 🟠 | Deeply oversold |
| OBV | n/a | — | Index has no volume |
| Williams %R (14) | −95.79 | 🟠 | Oversold |
Analytical Commentary
Quantitative frame. The semiconductors’ Compass records recent momentum confirming the decline, a strongly bearish operating regime and price far below the underlying trend, which stays bullish and solid. But the short- and medium-term readings are at odds and reliability is suspended, so the signal is scattered. Inside that frame the 4 layers describe the most extreme case on the equity panel: a vertical fall that has come knocking on the door of the 200-day average.
Candlestick. On Friday the SOX touched 10,668, below the SMA200, then climbed back to close at 10,779 (+0.44%), leaving a small white body with a long upper shadow. The low under the average and the close above it tell the story of a first defense; the upper shadow (up to 10,923) says buyers didn’t have the strength to hold the session’s highs.
Moving Averages. It’s the US index furthest from its own SMA50: −9.79%. The EMA20 (11,770) is at −8.42% and falling steeply. The SMA200 (10,690) is the line in the sand: price is testing it from above for the first time since late April. This is where the correction gets decided, pause or break.
Ichimoku Kinko Hyo. Price is well below the cloud and the Tenkan (11,442) is below the Kijun (12,008), while the SAR (12,063) and the Chandelier (12,146) sit far overhead. None of the structure tools offers a handhold before the 200-day.
Bands & Levels. Price has closed below the lower Keltner (10,950) for the last two sessions and is hugging the lower Bollinger (10,544), with the bands extremely wide. Below the SMA200 sit the 10,559 zone and pivot S2 (10,435); further down, over the past year, there’s no meaningful support zone until the 8,430 area. That’s the detail that makes holding the 200 matter more than usual.
Oscillators & Flows. The ADX is at 25.6, with −DI (41.5) nearly triple +DI (15.1): the downtrend is confirmed. The MACD is deep in negative territory and Aroon Down is at 96. The Stochastic (8.9) and Williams %R (−96) are deeply oversold and the Ulcer Index (11.9) is near its highest levels in the period shown, comparable to July: the pain of staying invested in this asset peaks just as price touches structural support. Flows can’t be measured, because the index has no volume.
🏛️ Pretore signature for the week:
- Mon:
active short→ Fri:active long— Δ flip - Operational stop, Friday close: 10,558.6201
🧭 Asset Compass ($SOX) · Friday close, October 23, 2026
  VERDICT           CONFIRMED        — recent momentum confirms
  OPERATING REGIME  STRONG BEAR
  LINEARITY         Non-linear trends
  COHERENCE         NONE
  RELIABILITY       SUSPENDED
  POSITION          --- extremely below — below the underlying trend
  UNDERLYING TREND  Persistent bull  — solid
Quantitative reading of the asset’s regime: the short- and medium-term readings pull in opposite directions and the signal is scattered, so the Compass suspends judgment and says wait, don’t bet on where it goes. Price is far below the underlying trend, which stays bullish and solid: a violent tactical decline inside a structural bull, and the 4 TA layers measure it as the most extreme case on the equity panel.
Detected Patterns
| Pattern | Status |
|---|---|
| Bearish wave with no bounces since the October 6 high | ✅ Confirmed |
| Closes below the lower Keltner in the last two sessions | ✅ Confirmed |
| SMA200 test with a close above | ✅ Confirmed |
| Bullish reversal off the SMA200 | ❌ Not visible — upper shadow, no confirmation |
📌 Operating Scenario
| Item | Description |
|---|---|
| Primary scenario | Fragile base on the SMA200, with price below 10,979 |
| Conditions | 10,559-10,690 holds on a closing basis; oversold conditions slowing the decline |
| Key support | 10,690 (SMA200) → 10,559 → 10,435 (S2) → 8,430 area |
| Key resistance | 10,923 (Friday’s high) → 10,950-10,979 (lower Keltner) → 11,208 → 11,532 (S1) |
| Warning level | Close below 10,435: the SMA200 breaks with a support vacuum beneath |
| Estimated timing | Decision within 1-2 weeks |
BIAS: BEARISH — Confirmed downtrend, with price deeply oversold on structural support. Whether the SMA200 holds decides pause or break.
🎯 FINBEAR Verdict
Direction: 🔴 Tactical bear on the SMA200
| Scenario | Trigger | Target | Note |
|---|---|---|---|
| ▶▶▶ CENTRAL THESIS — Fragile base on the SMA200 | 10,559 holds with price below 10,979 | Range 10,559 – 10,979 | Deeply oversold, downtrend not yet exhausted |
| ▶▶ ALTERNATIVE SCENARIO — SMA200 breaks | Close below 10,435 (S2) | 8,430 area (first meaningful support) | −DI dominant, support vacuum |
| ▶ TAIL SCENARIO — Extended technical bounce | Close above 11,208 | 11,532 (S1) → 11,770 (EMA20) | Needs the Keltner recovered; the SAR at 12,063 remains the next resistance |
📡 Operating levels, decision dashboard and summary verdict for this asset → CTM Signal™
📎 The semiconductor chart shows that the most violent fall on the equity panel has stopped, for now, on the 200-day average. It doesn’t say whether the artificial-intelligence story is cracking or positioning is just deflating. The week’s story lives in the RADAR Pro Elite editions. The 200 is where those who bought the story part ways with those who bought the numbers.
📈 Technical Charts — $SOX
Section produced for Module C — FINBEAR™ Strategic Report — October 24, 2026
⚖️ Cross-Index Comparison — US
| Parameter | SPX | NDX | COMPQ | INDU | SOX | Leader |
|---|---|---|---|---|---|---|
| Session change | −0.52% | 0.00% | −0.21% | −1.23% | +0.44% | SOX |
| Candlestick | small red body, indecision at the new low | small body, long upper shadow (bounce rejected) | small body with upper shadow | full red body, opened at the high | small white body, long upper shadow, low below the SMA200 | — |
| Position vs SMA50 | below, −0.99% | below, −2.92% | below, −2.42% | just below, −0.20% | below, −9.79% | INDU |
| RSI(14) | 42.15 | 36.67 | 38.01 | 52.48 | 32.31 | INDU |
| MACD config. | bearish (below the signal line, just below zero) | bearish (below the signal line and below zero) | bearish (below the signal line and below zero) | bullish (above the signal line and above zero) | bearish (below the signal line and below zero) | INDU |
| SAR | bearish (7,780.64 above) | bearish (30,622.54 above) | bearish (27,179.46 above) | bearish (52,927.88 above, flipped Friday) | bearish (12,062.67 above) | — |
| Position vs Kumo | inside (lower part) | hugging the lower edge | inside (lower part) | hugging the lower edge (bearish cloud) | well below | INDU |
| CMF(20) | −0.040 | −0.089 | −0.136 | +0.083 | n/a | INDU |
| Ulcer Index | 1.27 | 4.42 | 3.50 | 0.45 | 11.88 | INDU |
| ADX (+DI/−DI) | 14.39 (16.65/30.58) | 24.79 (14.12/39.68) | 21.85 (14.72/38.58) | 20.43 (29.52/21.46) | 25.55 (15.08/41.45) | INDU (+DI) |
| Bias | NEUTRAL-WEAK | BEARISH | BEARISH | NEUTRAL-POSITIVE | BEARISH | INDU |
Reading: The US picture is tilted to the downside, with one exception. $NDX, $COMPQ and $SOX are in a correction confirmed by the momentum layers, with −DI between 38 and 42 and MACD below zero; $SOX pays the most (−9.79% from the SMA50, Ulcer 11.88) and ends the week testing its long average. $SPX loses the SMA50 but without a trend (ADX 14.4): it’s sliding, not crashing. $INDU is the only one with a bullish MACD, positive CMF and +DI above −DI, even though it gave up 1.23% on Friday with the SAR flipping above price. The message is a defensive rotation inside equities: it’s the AI trade, not the whole market, that’s making way for the old economy.
PART II — CURRENCIES & RATES
📊 US Dollar Index ($USD / DXY) — 101.75
Date: Friday, October 23, 2026 | Change: +0.183 (+0.18%) | Volume: n/a (index)
Daily range: 101.489 – 101.853 | Prev. Close: 101.569
Indicator Table
| Indicator | Value | Signal | Notes |
|---|---|---|---|
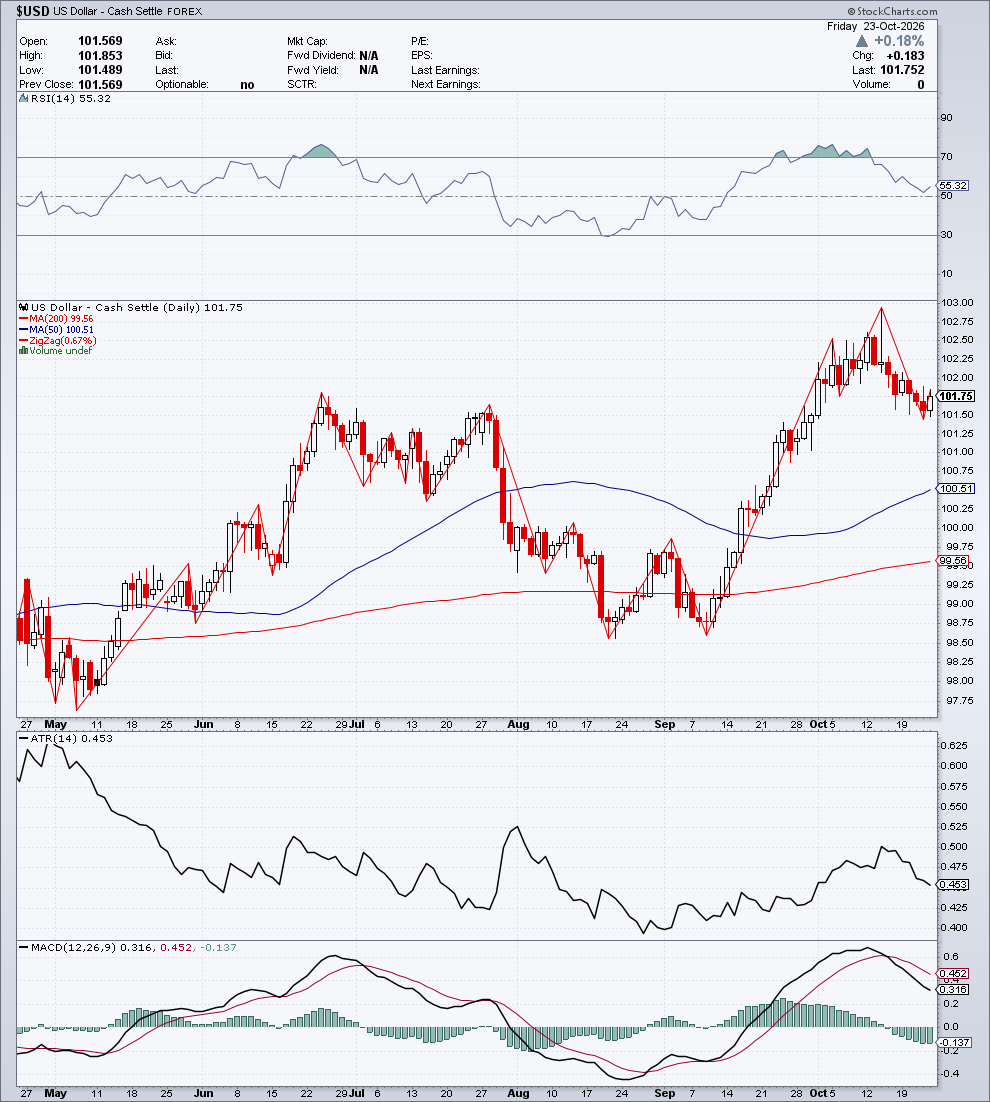
| Trend | Bullish, retracing | 🟢 | Price > SMA50 > SMA200; pulling back from the mid-October high |
| SMA 200 | 99.56 | Below price | +2.20% |
| SMA 50 | 100.51 | Below price | +1.24% — average rising |
| Zig Zag (0.67%) | low ~98.6 (Sep 9) → high ~102.9 (Oct 13) → 101.75 | — | A retracement of just over a quarter of the up leg |
| RSI (14) | 55.32 | ⚪ | Down from early-October overbought into neutral territory |
| MACD (12,26,9) | 0.316 / 0.452 | 🔴 | Histogram −0.137; line below the signal line, bearish crossover at the high |
| ATR (14) | 0.453 | ↓ | Falling from the mid-October peak |
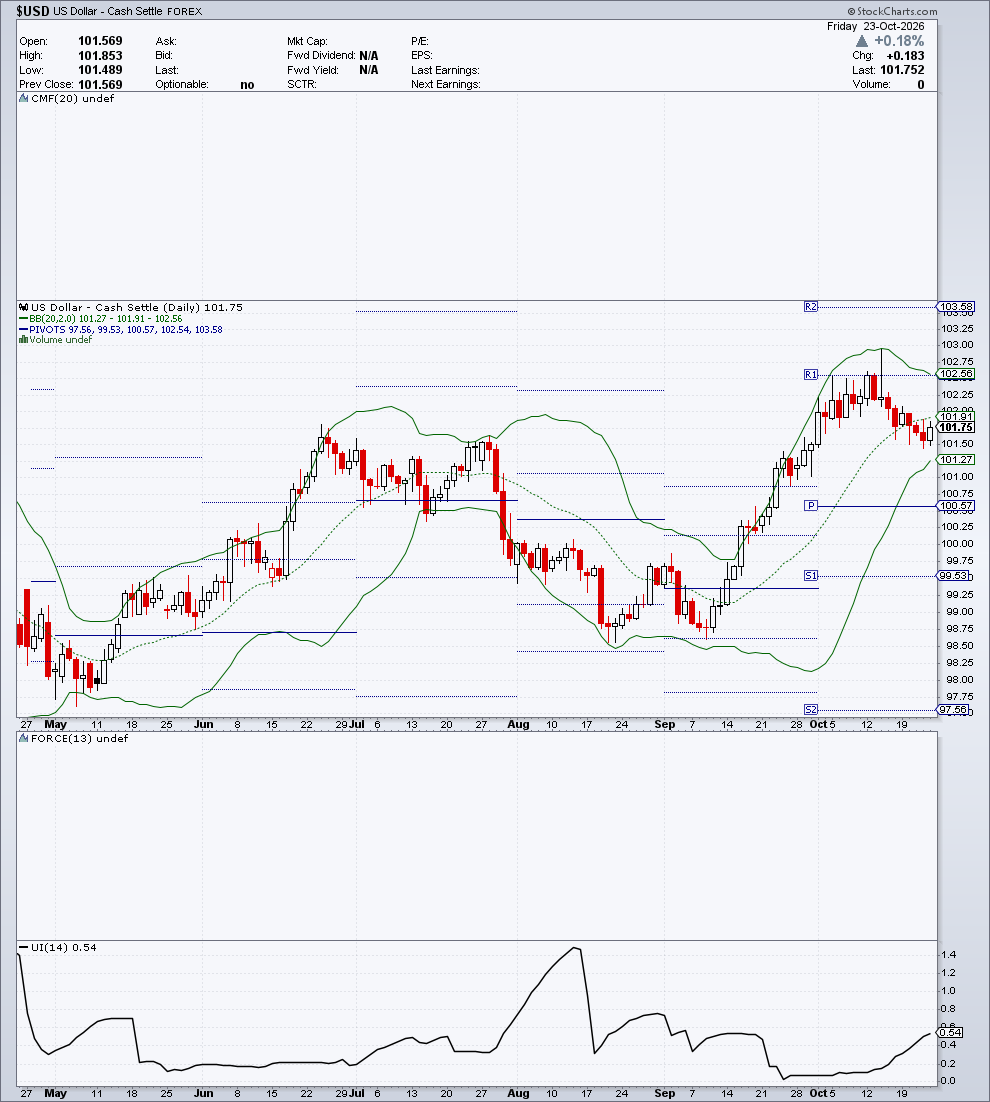
| Bollinger (20,2) | 101.27 / 101.91 / 102.56 | below the midline | Price in the lower half |
| Pivot Points | S2 97.56 · S1 99.53 · P 100.57 · R1 102.54 · R2 103.58 | between P and R1 | Above the central pivot |
| Volume by Price | n/a | — | Index with no volume |
| CMF (20) | n/a | — | Index with no volume |
| Force Index (13) | n/a | — | Index with no volume |
| Ulcer Index (14) | 0.54 | low | Drawdown contained, edging higher |
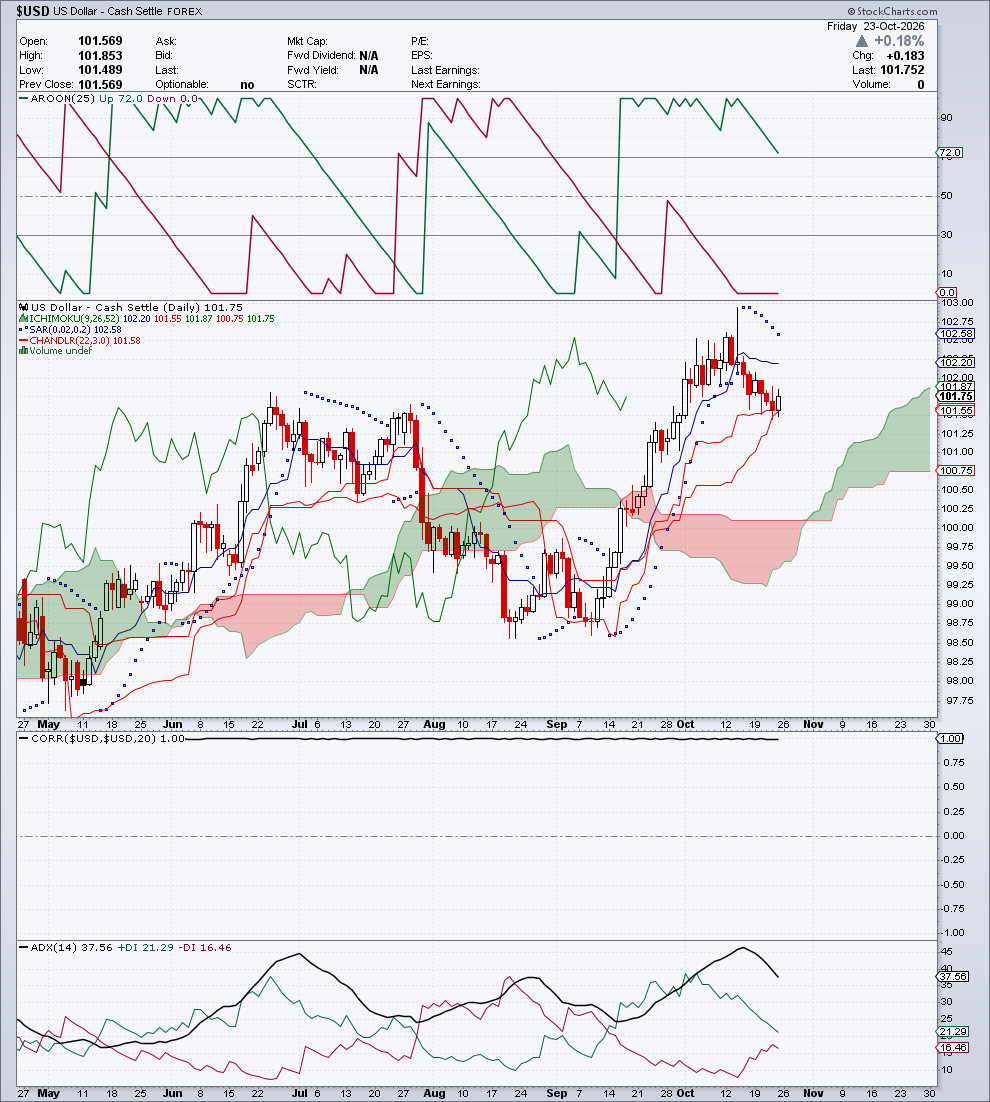
| Ichimoku Full | 102.20 / 101.55 / 101.87 / 100.75 | 🟢 | Price above the Kumo; between the Tenkan (above) and the Kijun (below); future Kumo green |
| Parabolic SAR | 102.58 | 🔴 | Above price: short-term bearish signal since mid-October |
| Chandelier Exit (22,3) | 101.58 | exit | Just below price (−0.17%) |
| Aroon (25) | Up 72 / Down 0 | 🟢 | Up falling but dominant; Down at zero |
| Correlation vs $USD (20) | 1.00 | — | Autocorrelation, not informative |
| ADX (14) | 37.56 (+DI 21.29 / −DI 16.46) | 🟢 | Confirmed trend, +DI above −DI; ADX easing from its peak |
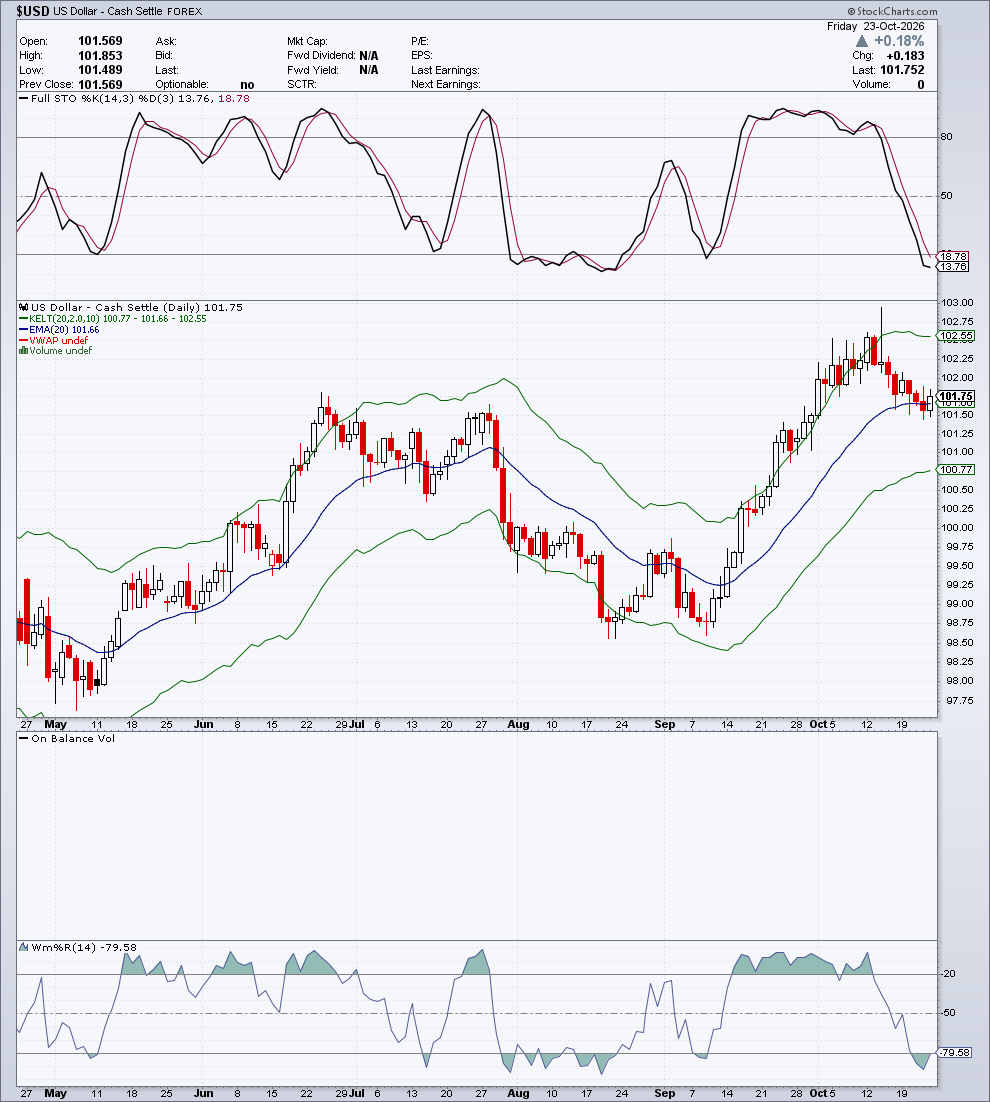
| Keltner Channels (20,2,10) | 100.77 / 101.66 / 102.55 | above the midline | Resting on the channel midline |
| EMA (20) | 101.66 | Below price | +0.09% — testing the EMA20/Kijun line |
| VWAP | n/a | — | Can’t be calculated on an index with no volume |
| Stochastic (14,3,3) | 13.76 / 18.78 | 🟢 (oversold) | Below 20: short-term oversold |
| OBV | n/a | — | Index with no volume |
| Williams %R (14) | −79.58 | ⚪ | On the edge of oversold |
Analytical Commentary
The dollar’s Compass captures a strongly bullish operating regime, coherent across the short and medium term, with medium reliability and a contested verdict — recent momentum neither confirms nor contradicts it. Within that frame, the four layers describe a bull catching its breath, not one throwing in the towel.
Candlestick. A white rebound candle on October 23: open 101.569, low 101.489, close 101.752 in the upper part of the session (about three quarters of the range). It’s the first up session after five straight declines from the mid-October high, with the day’s low resting on the Kijun (101.55) and the Chandelier (101.58). Buyers are defending the Kijun, but they aren’t raising the stakes yet.
Moving Averages. The structure is clean: SMA50 (100.51) above SMA200 (99.56), both rising, price above both. The EMA20 (101.66) is short-term support, and the close just grazes it (+0.09%), a sign that the pullback has landed exactly on the line that has carried the climb since September.
Ichimoku Kinko Hyo. Price sits above the Kumo, which projects a green cloud forward (Span A 101.87 above Span B 100.75): the underlying structure isn’t in question. Price has, however, slipped back below the Tenkan (102.20) and is working just above the Kijun (101.55): the textbook breather inside an uptrend. The SAR (102.58) has been above price since mid-October.
Bands & Levels. Price is in the lower half of the Bollinger bands (midline 101.91), leaning on the Keltner midline (101.66). The central pivot (100.57), much further down, nearly coincides with the SMA50 (100.51): that’s the second line of defense. Overhead, R1 (102.54) and the SAR (102.58) form a single barrier, ahead of the high around 102.9.
Oscillators & Flows. Momentum has cooled: MACD below its signal line with a negative histogram, RSI down to 55.3 from early-October overbought, ATR falling. The ADX (37.6) holds above 25 with +DI (21.3) over −DI (16.5), though it’s easing: the trend is still there, the thrust less so. Oversold Stochastics (13.8/18.8) and Williams %R at −79.6 say the short-term pullback has already let off much of the pressure. Flows can’t be measured on an index with no volume.
🏛️ Pretore signature for the week:
- Mon:
active long→ Fri:active long— Δ unchanged - Operational stop, Friday close: 27.935 (UUP proxy scale)
🧭 Asset Compass ($USD) · Friday close, October 23, 2026
  VERDICT           CONTESTED        — recent momentum neutral
  OPERATING REGIME  STRONG BULL
  LINEARITY         Ordinary trends
  COHERENCE         FULL
  RELIABILITY       MEDIUM
  POSITION          ++ extended      — above the underlying trend
  UNDERLYING TREND  Persistent bull  — fragile
Quantitative reading of the asset’s regime: the box is based on the ETF that tracks the dollar index and follows its direction. The operating regime is bullish, coherent across the short and medium term, with recent momentum at a standstill and medium reliability that calls for a cautious reading; price stays extended above an underlying trend that is bullish but fragile. It’s the same picture the four layers paint: bullish structure intact, short-term thrust on pause.
Detected Patterns
| Pattern | Status |
|---|---|
| Pullback to the EMA20 inside an uptrend | ✅ Confirmed |
| Bearish MACD crossover at the mid-October high | ✅ Confirmed |
| Rebound candle on the Kijun | ⚠️ Forming — needs confirmation in the next session |
📌 Operating Scenario
| Item | Description |
|---|---|
| Primary scenario | The 101.55-101.66 band (Kijun/EMA20) holds and the uptrend resumes |
| Conditions | Price reclaims the Tenkan (102.20) and clears the SAR (102.58) |
| Key support | 101.55 (Kijun) → 101.27 (lower Bollinger) → 100.51-100.57 (SMA50/pivot) |
| Key resistance | 102.20 (Tenkan) → 102.54-102.58 (R1/SAR) → 102.9 area (high) |
| Warning level | Close below 101.27: the pullback stretches toward the SMA50 |
| Estimated timing | Resolution within 1-2 weeks |
BIAS: NEUTRAL-POSITIVE — A well-built uptrend taking a breather. Above 102.20 the CENTRAL THESIS gains strength; below 101.27 the ALTERNATIVE SCENARIO takes over.
🎯 FINBEAR Verdict
Direction: 🟡 Bull pausing on the EMA20/Kijun line
| Scenario | Trigger | Target | Note |
|---|---|---|---|
| ▶▶▶ CENTRAL THESIS — Rebound off the EMA20/Kijun line | 101.55 holds + close above 102.20 | 102.54-102.9 | ADX above 25, +DI dominant, Stochastics oversold |
| ▶▶ ALTERNATIVE SCENARIO — Extended pullback | Close below 101.27 | 100.51-100.57 (SMA50/pivot) | MACD negative, SAR above price |
| ▶ TAIL SCENARIO — Structure breaks | Close below 100.51 | 99.53-99.56 (S1/SMA200) | Only if the SMA50 gives way |
📡 Operating levels, decision dashboard and summary verdict for this asset → CTM Signal™
📎 The dollar chart says the bull has caught its breath on support, not changed its mind. Structure, Kumo and ADX are still on its side. What the chart doesn’t say is who’s buying it and why: the rate differential, the demand for dollars that travels with oil and geopolitical tension, the euro’s weakness. Those answers live in the RADAR Pro Elite. Read the dollar as just a line on a screen and you forget it’s the yardstick everything else is measured by.
📈 Technical Charts — $USD
Section produced for Module C — FINBEAR™ Strategic Report — October 24, 2026
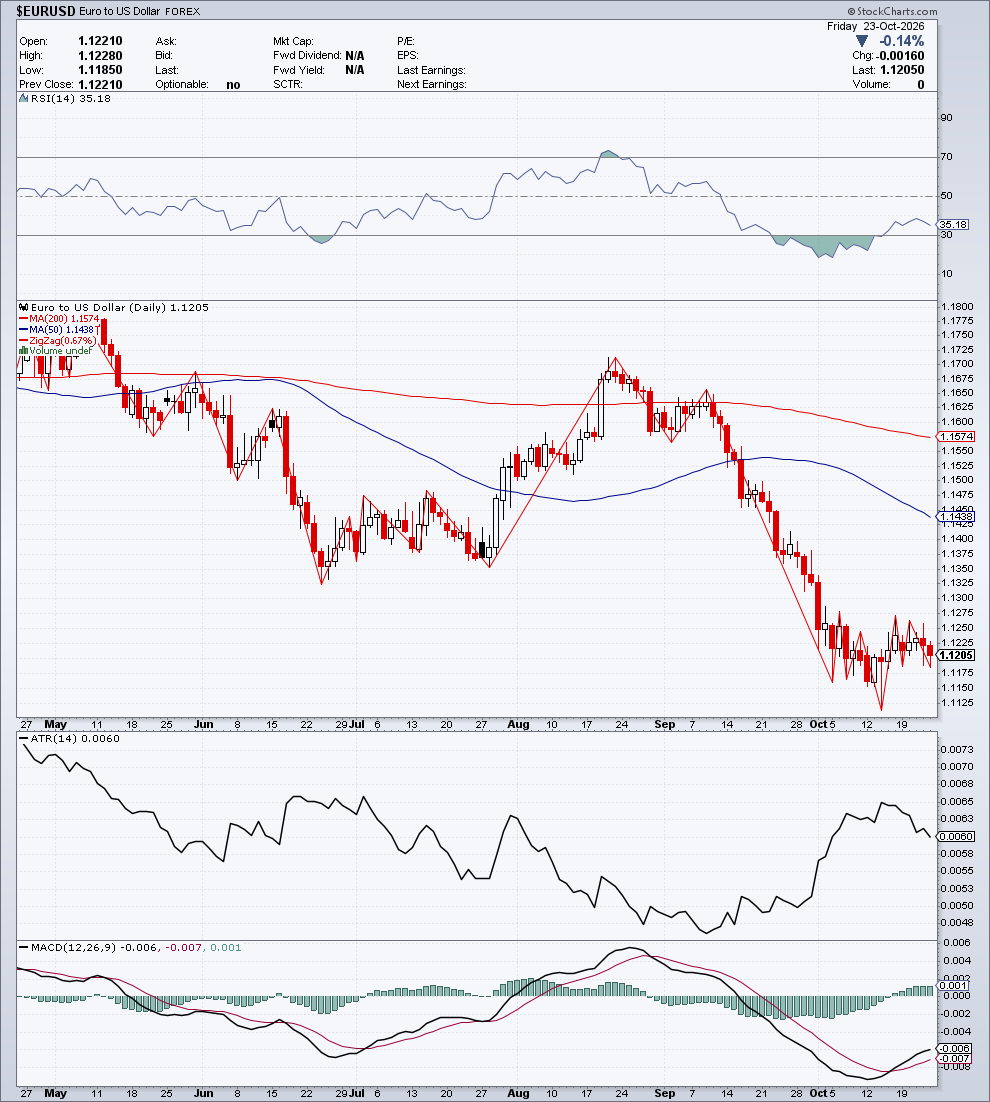
📊 Euro/Dollar ($EURUSD) — 1.1205
Date: Friday, October 23, 2026 | Change: −0.0016 (−0.14%) | Volume: n/a (forex)
Daily range: 1.1185 – 1.1228 | Prev. Close: 1.1221
Indicator Table
| Indicator | Value | Signal | Notes |
|---|---|---|---|
| Trend | Bearish, in a sideways base | 🔴 | Price < SMA50 < SMA200; sideways at 1.113-1.127 after the September slide |
| SMA 200 | 1.1574 | Above price | −3.19% |
| SMA 50 | 1.1438 | Above price | −2.04% — average falling |
| Zig Zag (0.67%) | high ~1.1715 (Aug 21) → low ~1.1130 (Oct 14) → 1.1205 | — | A clean down leg, then a sideways base |
| RSI (14) | 35.18 | 🔴 | Out of oversold, still weak |
| MACD (12,26,9) | −0.006 / −0.007 | 🟢 | Histogram +0.001; bullish crossover below zero |
| ATR (14) | 0.0060 | ↓ | Falling from the mid-October peak |
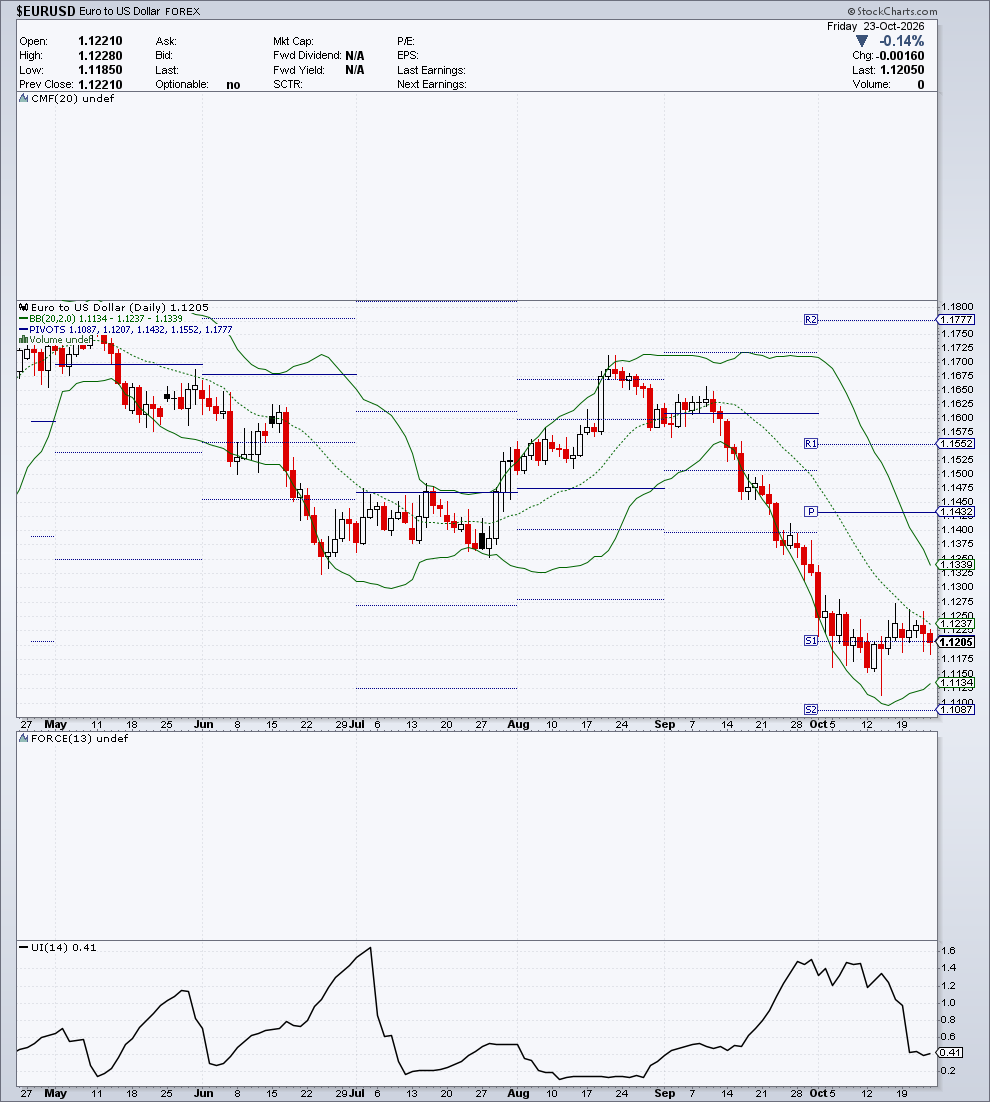
| Bollinger (20,2) | 1.1134 / 1.1237 / 1.1339 | below the midline | Bands narrowing |
| Pivot Points | S2 1.1087 · S1 1.1207 · P 1.1432 · R1 1.1552 · R2 1.1777 | on pivot S1 | Price resting on the first support |
| Volume by Price | n/a | — | Forex, no volume |
| CMF (20) | n/a | — | Forex, no volume |
| Force Index (13) | n/a | — | Forex, no volume |
| Ulcer Index (14) | 0.41 | low | Collapsed from its early-October peak: the stress of the decline has been released |
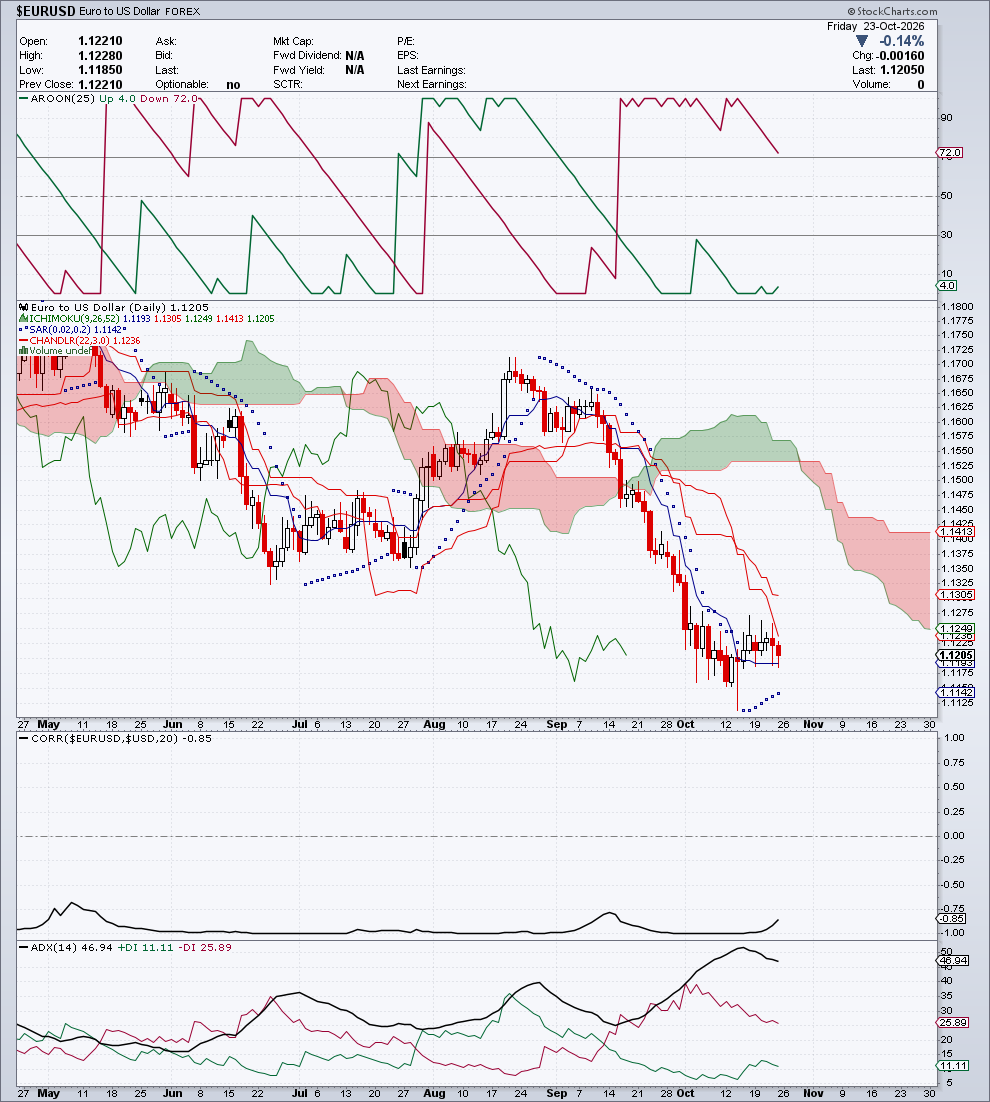
| Ichimoku Full | 1.1193 / 1.1305 / 1.1249 / 1.1413 | 🔴 | Price below the Kumo; future Kumo red (Span B above Span A) |
| Parabolic SAR | 1.1142 | 🟢 | Below price: short-term bullish signal |
| Chandelier Exit (22,3) | 1.1236 | — | Above price: a level to reclaim |
| Aroon (25) | Up 4 / Down 72 | 🔴 | Down dominant, falling |
| Correlation vs $USD (20) | −0.85 | − | Strongly inverse: the dollar’s mirror image |
| ADX (14) | 46.94 (+DI 11.11 / −DI 25.89) | 🔴 | Downtrend of exceptional strength; ADX easing slightly |
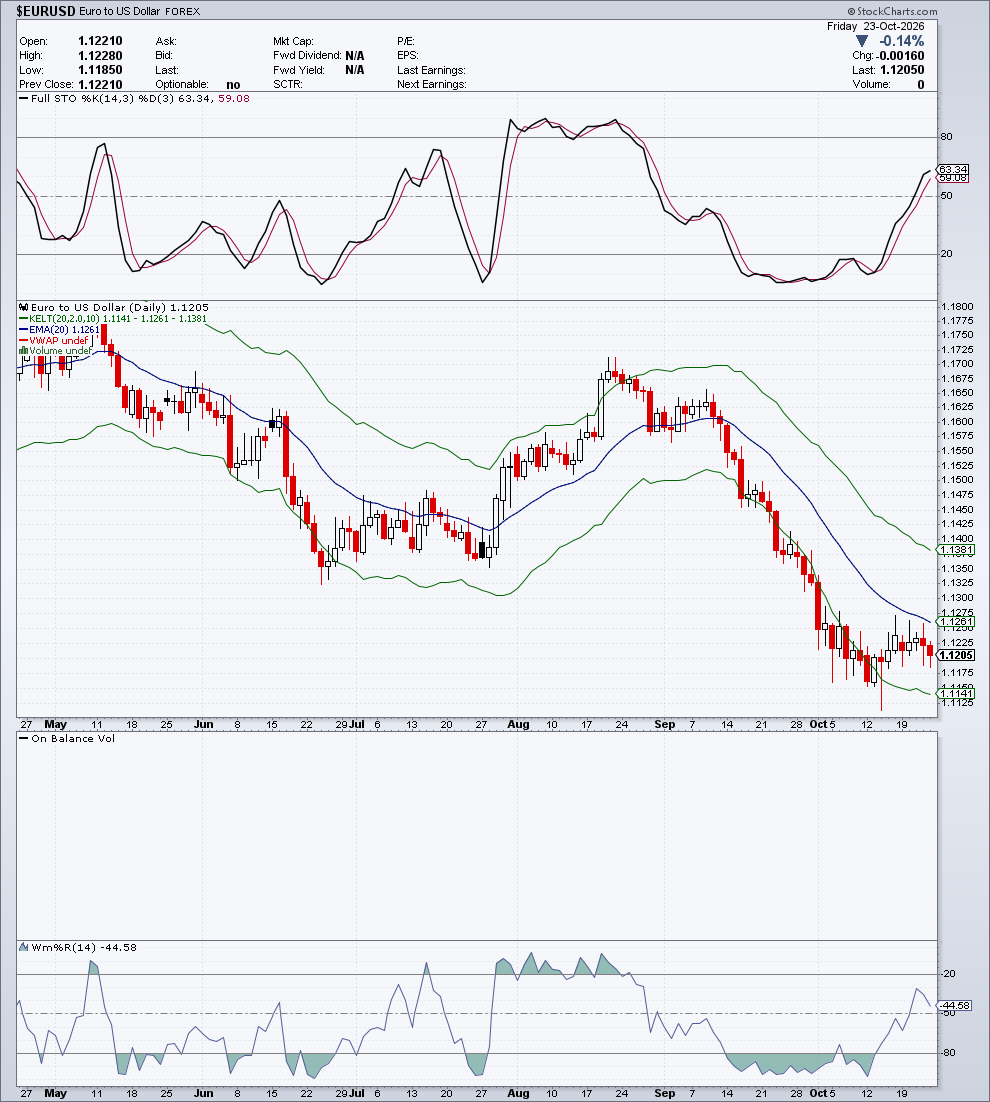
| Keltner Channels (20,2,10) | 1.1141 / 1.1261 / 1.1381 | below the midline | Lower half of the channel |
| EMA (20) | 1.1261 | Above price | −0.50% |
| VWAP | n/a | — | Can’t be calculated without volume |
| Stochastic (14,3,3) | 63.34 / 59.08 | 🟢 | Back up from oversold, %K above %D |
| OBV | n/a | — | Forex, no volume |
| Williams %R (14) | −44.58 | ⚪ | In the middle zone |
Analytical Commentary
The euro’s Compass measures a moderately bearish operating regime, coherent across the short and medium term and with high reliability, with price below the underlying trend and a backdrop in transition; recent momentum neither confirms nor contradicts it. The four layers reach the same diagnosis: the bear won the battle of September and is now catching its breath in a sideways base.
Candlestick. A small-bodied red candle on October 23: open 1.1221, close 1.1205, low 1.1185 with a lower shadow. The body is just over a third of the range, a sign of indecision inside a sideways range that has held for two weeks between 1.113 and 1.127. No breakdown, no surrender.
Moving Averages. The structure is bearish beyond doubt: SMA50 (1.1438) below SMA200 (1.1574), both falling, price below both and below the EMA20 (1.1261). The slide from 1.165 in early September to 1.113 in mid-October left the averages far behind. The distance from the SMA200 (−3.2%) measures how much ground the euro still has to make up.
Ichimoku Kinko Hyo. Price stays well below the Kumo, which projects a red future cloud (Span B 1.1413 above Span A 1.1249): the structural ceiling is a thick one. Price sits just above the Tenkan (1.1193) and below the Kijun (1.1305), the first level to win back. The SAR, below price at 1.1142, signals only that the short-term decline has stopped.
Bands & Levels. The Bollinger bands are narrowing (1.1134-1.1339) and price is below the midline: volatility is compressing after the down leg. Price rests on pivot S1 (1.1207); below it sits S2 (1.1087), above it the Chandelier (1.1236) and the EMA20 (1.1261). The central pivot (1.1432) nearly coincides with the SMA50, making it the level that would separate a technical bounce from a change in the picture.
Oscillators & Flows. This is where the friction shows. The ADX at 46.9, with −DI (25.9) more than double +DI (11.1), and Aroon Down at 72 say the downtrend is still the one in charge. But short-term momentum has turned: a bullish MACD crossover below zero, Stochastics back up to 63, the Ulcer Index collapsed to 0.41. The −0.85 correlation with the dollar confirms the euro is moving as the greenback’s mirror image. In short: a mature bear taking a breather, not a bear that’s finished.
🏛️ Pretore signature for the week:
- Mon:
active long→ Fri:active short— Δ flip - Operational stop, Friday close: 105.595 (FXE proxy scale)
🧭 Asset Compass ($EURUSD) · Friday close, October 23, 2026
  VERDICT           CONTESTED        — recent momentum neutral
  OPERATING REGIME  Moderate bear
  LINEARITY         Ordinary trends
  COHERENCE         FULL
  RELIABILITY       HIGH
  POSITION          -- below trend   — below the underlying trend
  UNDERLYING TREND  Mixed / transition — fragile
Quantitative reading of the asset’s regime: the box is based on the euro ETF, which follows the exchange rate in the same direction. The operating regime is bearish, coherent across the short and medium term, with recent momentum at a standstill; price is below an underlying trend that has yet to choose a direction, and the position calls for a cautious reading. It’s the quantitative frame for the sideways base the four layers describe: an orderly bearish regime against an uncertain backdrop.
Detected Patterns
| Pattern | Status |
|---|---|
| Sideways base at 1.113-1.127 after the down leg | ✅ Confirmed |
| Bullish MACD crossover below zero | ✅ Confirmed |
| Bollinger squeeze | ⚠️ Forming |
📌 Operating Scenario
| Item | Description |
|---|---|
| Primary scenario | Sideways trading between 1.113 and 1.1305, below the Kijun, inside the downtrend |
| Conditions | No close above 1.1305; the 1.113 low holds |
| Key support | 1.1207 (S1) → 1.1142 (SAR) → 1.113 area (low) → 1.1087 (S2) |
| Key resistance | 1.1236-1.1261 (Chandelier/EMA20) → 1.1305 (Kijun) → 1.1339 (upper Bollinger) |
| Warning level | Close below 1.1087: the down leg resumes |
| Estimated timing | The base resolves within 1-3 weeks |
BIAS: NEUTRAL-WEAK — A downtrend of exceptional strength pausing sideways. Above 1.1305 the technical bounce takes shape; below 1.1087 the bear resumes its run.
🎯 FINBEAR Verdict
Direction: 🔴 Mature bear in a sideways base
| Scenario | Trigger | Target | Note |
|---|---|---|---|
| ▶▶▶ CENTRAL THESIS — Sideways base inside the bear | Price between 1.113 and 1.1305 | Range 1.113-1.1305 | ADX at an extreme with −DI dominant, short-term momentum recovering |
| ▶▶ ALTERNATIVE SCENARIO — Technical bounce | Close above 1.1305 (Kijun) | 1.1339-1.1381 → 1.1432 (pivot/SMA50) | MACD bullish, Stochastics rising |
| ▶ TAIL SCENARIO — New down leg | Close below 1.1087 (S2) | New lows for the period | Further levels not visible on the chart |
📡 Operating levels, decision dashboard and summary verdict for this asset → CTM Signal™
📎 The euro chart tells of a fall of more than five big figures between early September and mid-October, and a base that for the past fifteen days has refused both collapse and recovery. What the chart doesn’t say is why the dollar is pulling in capital, how heavily triple-digit oil weighs on a European economy that imports its energy, and what’s left of the gap between the Fed and the ECB. That’s RADAR Pro Elite territory. For anyone holding a euro portfolio with dollar assets, this exchange rate isn’t a technical detail: it’s the invisible tax on every American return.
📈 Technical Charts — $EURUSD
Section produced for Module C — FINBEAR™ Strategic Report — October 24, 2026
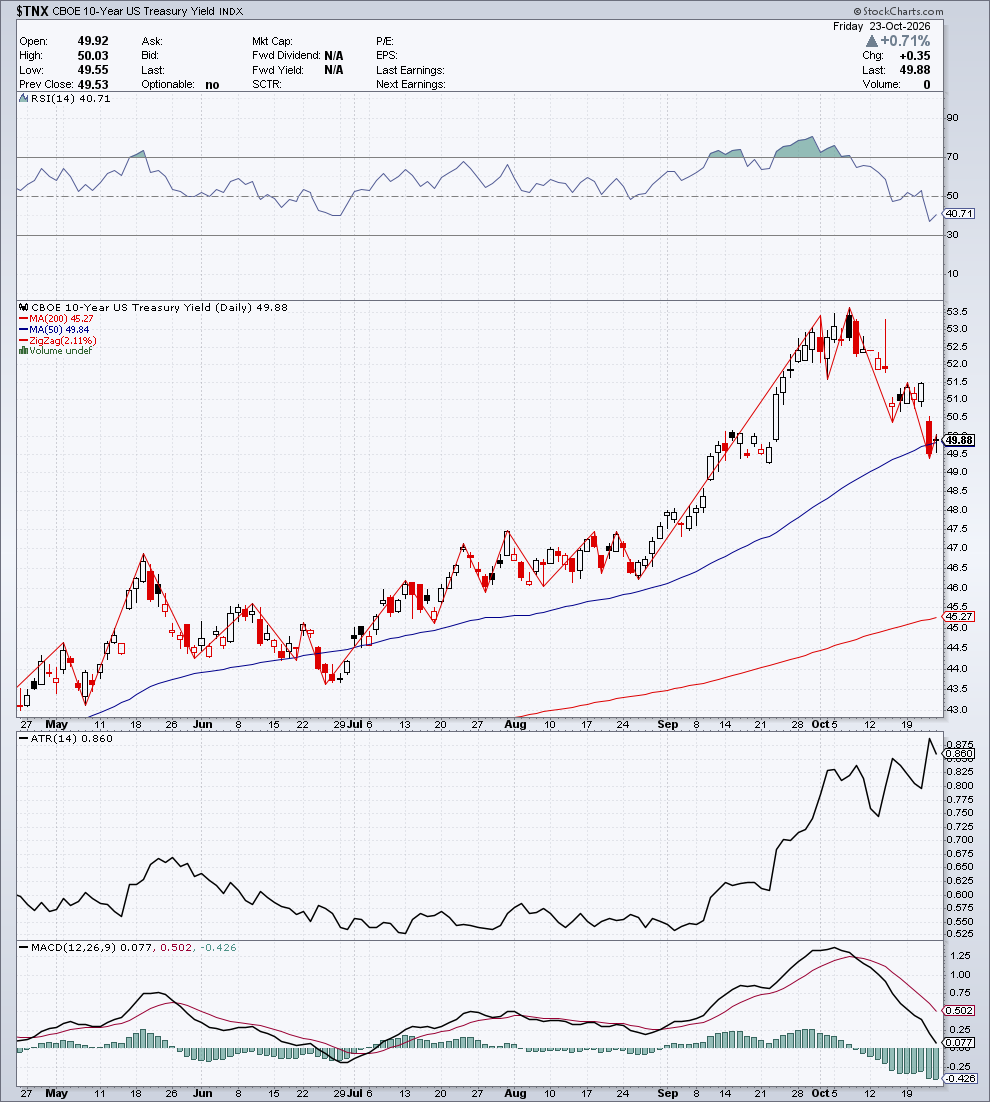
📊 Treasury 10Y Yield ($TNX) — 4.988%
Date: Friday, October 23, 2026 | Change: +0.035 pp (+0.71%) | Volume: n/a (yield index)
Daily range: 4.955% – 5.003% | Prev. Close: 4.953%
Indicator Table (chart values in ×10 units; % yield in brackets)
| Indicator | Value | Signal | Notes |
|---|---|---|---|
| Trend | Underlying uptrend, correcting | 🟢/⚪ | Yield > SMA200, resting on the SMA50; falling from the early-October high |
| SMA 200 | 45.27 (4.527%) | Below | +10.18% |
| SMA 50 | 49.84 (4.984%) | Below, touching | +0.08% — testing the tactical average |
| Zig Zag (2.11%) | from ~43 (late April) → high ~53.6 (early October) → 49.88 | — | Correction after six months of gains |
| RSI (14) | 40.71 | 🔴 | Below the midline, rising from Thursday’s low |
| MACD (12,26,9) | 0.077 / 0.502 | 🔴 | Histogram −0.426; line falling toward zero |
| ATR (14) | 0.860 | ↓ | Slightly lower on Friday, close to six-month highs: rate volatility is high |
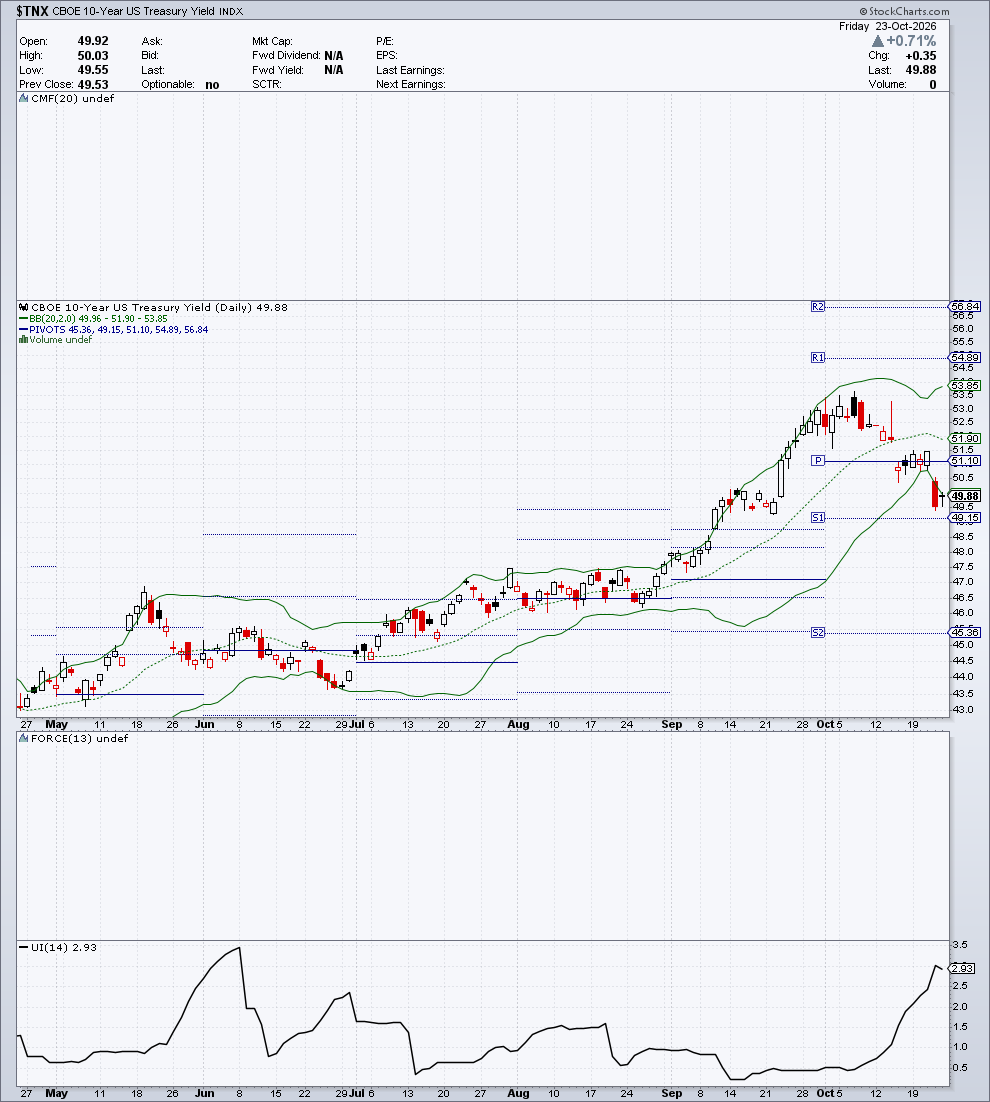
| Bollinger (20,2) | 49.96 / 51.90 / 53.85 | below the lower band | Close just below the lower band |
| Pivot Points | S2 45.36 · S1 49.15 · P 51.10 · R1 54.89 · R2 56.84 | between S1 and P | Below the central pivot |
| Volume by Price | n/a | — | Index with no volume |
| CMF (20) | n/a | — | Index with no volume |
| Force Index (13) | n/a | — | Index with no volume |
| Ulcer Index (14) | 2.93 | medium, rising | Highest since early June |
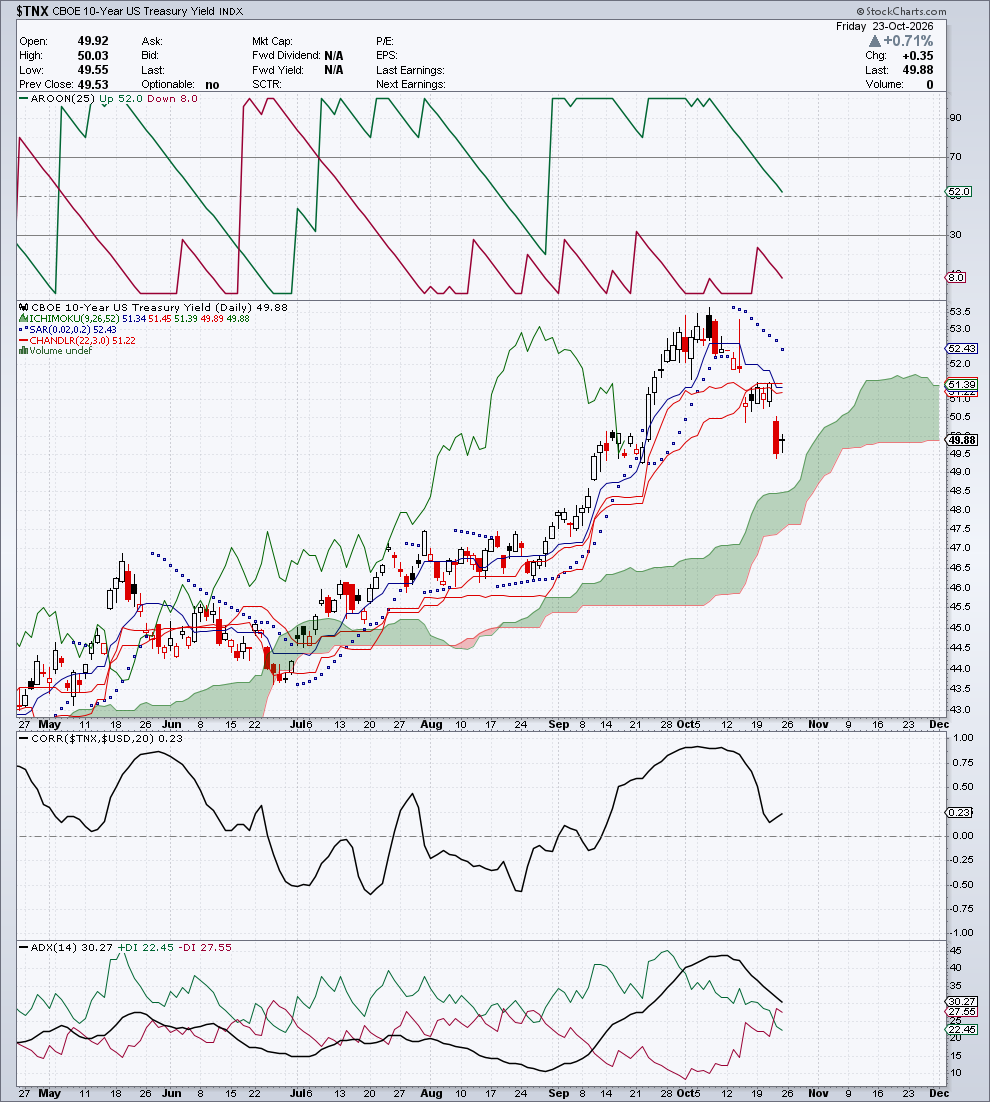
| Ichimoku Full | 51.34 / 51.45 / 51.39 / 49.89 | ⚪ | Yield above the Kumo but below the Tenkan and the Kijun |
| Parabolic SAR | 52.43 | 🔴 | Above the yield |
| Chandelier Exit (22,3) | 51.22 | — | Above the yield: exit level breached |
| Aroon (25) | Up 52 / Down 8 | ⚪ | Up falling from 100 in early October |
| Correlation vs $USD (20) | +0.23 | + | Weak, collapsed from values close to +1 |
| ADX (14) | 30.27 (+DI 22.45 / −DI 27.55) | 🔴 | Trend still above 25, but −DI has crossed above +DI |
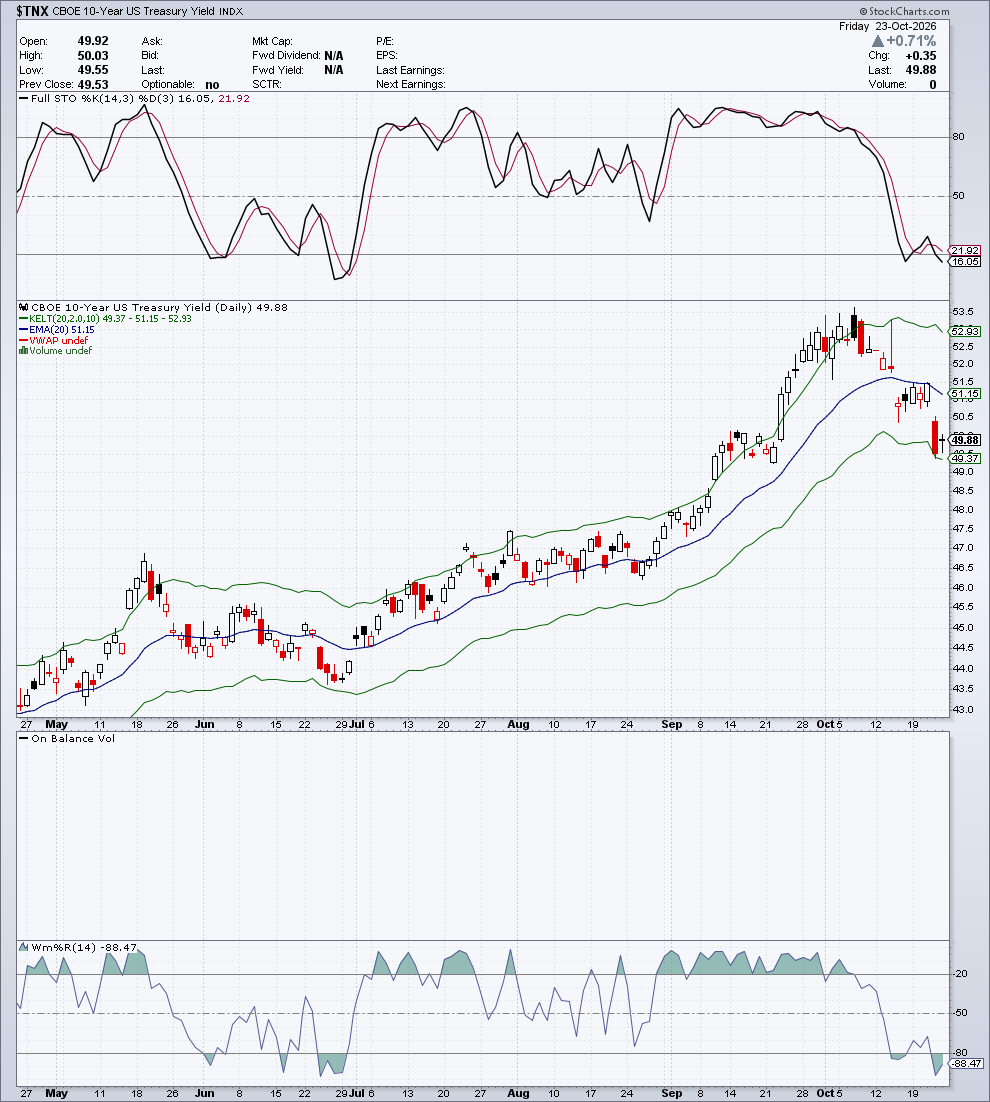
| Keltner Channels (20,2,10) | 49.37 / 51.15 / 52.93 | below the midline | Near the lower edge |
| EMA (20) | 51.15 (5.115%) | Above the yield | −2.48% |
| VWAP | n/a | — | Can’t be calculated without volume |
| Stochastic (14,3,3) | 16.05 / 21.92 | 🟢 (oversold) | Below 20 |
| OBV | n/a | — | Index with no volume |
| Williams %R (14) | −88.47 | 🟢 (oversold) | Below −80 |
Analytical Commentary
The Compass for the 10-year yield is based on the price of 7-10-year Treasuries, which moves opposite to the yield, so it has to be read inversely. On price, it measures a sideways operating regime, with the short- and medium-term readings pulling in opposite directions and recent upside momentum that contradicts the regime. Translated to the yield, that’s this week’s decline. The underlying trend in price is a solid structural bear, meaning a yield that keeps climbing over the long horizon. Within that frame, the four layers show a rise in rates interrupted in the short term, inside an underlying trend that is still pointing up.
Candlestick. The October 23 candle is a spinning top: open 4.992%, close 4.988%, low 4.955%, a body of a few tenths of a basis point on a range of almost five. It follows the week’s most important candle, the long red bar of Thursday, October 22, which gapped below the prior close and slid to around 4.95%. On Friday the bond market stood back and watched.
Moving Averages. The yield stays well above the SMA200 (4.527%) and rests exactly on the SMA50 (4.984%, +0.08%): the climb that began in May isn’t broken yet, but the tactical average is on trial. The EMA20 (5.115%) was lost with Thursday’s candle and now acts as a ceiling.
Ichimoku Kinko Hyo. The yield sits above the Kumo but below the Tenkan (5.134%) and the Kijun (5.145%), which now almost overlap: the short-term trend has fizzled out. With the SAR (5.243%) above and the Chandelier (5.122%) breached, the exit signal from the uptrend has fired.
Bands & Levels. The close lands just below the lower Bollinger band (4.996%) and above the lower Keltner (4.937%): the yield is working the edge of the channel. Pivot S1 (4.915%) is the first support below the SMA50; the central pivot (5.110%) and the EMA20 coincide in the same resistance band.
Oscillators & Flows. Momentum is cooling sharply: MACD histogram at −0.426 with the line falling, RSI at 40.7, −DI (27.6) above +DI (22.5) with the ADX still at 30. Stochastics (16.1) and Williams %R (−88.5) are oversold, so the short-term decline is already stretched. What carries weight is the ATR, close to its six-month high, with the Ulcer rising: rates are moving more, not less. The correlation with the dollar has dropped to +0.23: the 10-year yield and the greenback have stopped walking in step.
🏛️ Pretore signature for the week:
- Mon:
active long→ Fri:active long— Δ unchanged - Operational stop, Friday close: n/a (IEF proxy scale)
- Reading note: the signature is calculated on IEF, a Treasury ETF that moves opposite to the yield. An
active longsignature on IEF, read on $TNX, indicates downward pressure on the yield.
🧭 Asset Compass ($TNX) · Friday close, October 23, 2026
  VERDICT           CONTRADICTED     — recent momentum contradicts
  OPERATING REGIME  Sideways
  LINEARITY         Ordinary trends
  COHERENCE         NONE
  RELIABILITY       HIGH
  POSITION          in band          — in line with the underlying trend
  UNDERLYING TREND  Structural bear  — solid
Quantitative reading of the asset’s regime: the box is based on the price of 7-10-year Treasuries and has to be read inversely for the yield. The short- and medium-term readings pull in opposite directions and recent momentum is challenging the regime: a contested regime, in transition, not a surrender. The solid underlying downtrend in price amounts to a structurally rising yield. The four-layer technical report records the same fracture: the underlying trend in rates intact, a short-term correction under way.
Detected Patterns
| Pattern | Status |
|---|---|
| October 22 bearish gap with a long red candle | ✅ Confirmed |
| Indecision spinning top on the SMA50 | ✅ Confirmed |
| −DI crossing above +DI | ✅ Confirmed |
| Trend reversal at the early-October high | ⚠️ Forming — needs a close below the SMA50 |
📌 Operating Scenario
| Item | Description |
|---|---|
| Primary scenario | A correction resting on the SMA50, oscillating between 4.915% and 5.145% |
| Conditions | The 4.915%-4.984% band (S1/SMA50) holds, with no recovery of the Kijun |
| Key support | 4.984% (SMA50) → 4.937% (lower Keltner) → 4.915% (S1) |
| Key resistance | 5.110-5.115% (pivot/EMA20) → 5.134-5.145% (Tenkan/Kijun) → 5.243% (SAR) |
| Warning level | Close below 4.915%: the correction becomes a decline toward the early-September base |
| Estimated timing | Resolution within 1-2 weeks |
BIAS: NEUTRAL-WEAK (on the yield) — Medium-term climb interrupted, momentum correcting. Below 4.915% the ALTERNATIVE SCENARIO takes over; above 5.145% the TAIL SCENARIO comes back into play.
🎯 FINBEAR Verdict
Direction: 🟡 Yield correcting on the tactical average
| Scenario | Trigger | Target | Note |
|---|---|---|---|
| ▶▶▶ CENTRAL THESIS — Correction on the SMA50 | 4.915% holds, no close above 5.145% | Range 4.915-5.145% | MACD negative, oscillators oversold |
| ▶▶ ALTERNATIVE SCENARIO — Deep correction | Close below 4.915% (S1) | 4.75-4.80% (early-September base) | −DI dominant, SAR above |
| ▶ TAIL SCENARIO — The climb resumes | Close above 5.145% (Kijun) | 5.243% → 5.36% area (high) | Requires clearing the SAR and the Chandelier |
📡 Operating levels, decision dashboard and summary verdict for this asset → CTM Signal™
📎 The 10-year’s chart says the run in yields toward 5.4% has stalled and the market has walked the price of time back to its tactical average, with volatility near its six-month highs. What the chart doesn’t say is whether the drop back below 5% comes from a Fed seen as more accommodative, a flight to quality or repositioning for the inflation oil is importing. That distinction lives in the RADAR Pro Elite. For bondholders, the point isn’t where the benchmark goes tomorrow, but what it costs to keep sitting in a chair that rocks this much.
📈 Technical Charts — $TNX
Section produced for Module C — FINBEAR™ Strategic Report — October 24, 2026
📊 ICE MOVE Index ($MOVE) — 103.31
Date: Friday, October 23, 2026 | Change: −3.53 (−3.30%) | Volume: n/a (index)
Daily range: 102.00 – 107.58 | Prev. Close: 106.84
Interpretive note: The MOVE Index measures the implied volatility of the U.S. bond market (Treasuries). It is the “VIX of bonds”. Low values = calm in the bond market. Rising values = growing stress on rates. It should always be read alongside the TNX (10Y yield) to identify critical divergences:
- MOVE ↑ + TNX ↑ = stress from rising rates (market fears tightening)
- MOVE ↑ + TNX ↓ = uncertainty over the rate path (Fed repricing)
- MOVE ↓ + TNX stable = bond-market calm (supportive for equities)
Indicator Table
Signals read on the stress level: 🔴 = bond stress rising, 🟢 = stress easing.
| Indicator | Value | Signal | Notes |
|---|---|---|---|
| Trend | Bullish (elevated stress) | 🔴 | MOVE > SMA50 > SMA200; consolidating below the early-October high |
| SMA 200 | 76.84 | Below the MOVE | +34.45% |
| SMA 50 | 88.38 | Below the MOVE | +16.89% — average rising steeply |
| Zig Zag (5.00%) | 73-78 base (August-mid-September) → late-September jump → high ~114 (early October) → 103.31 | — | A change of level, then a 95-114 range |
| RSI (14) | 55.76 | ⚪ | Above the midline, down from early-October overbought |
| MACD (12,26,9) | 3.469 / 4.333 | 🟢 | Histogram −0.864; line below the signal line but in positive territory |
| ATR (14) | 5.084 | ↑ | At its six-month high |
| Bollinger (20,2) | 94.72 / 103.31 / 111.89 | on the midline | Close exactly on the middle band |
| Pivot Points | S2 60.61 · S1 85.53 · P 98.03 · R1 122.95 · R2 135.45 | between P and R1 | Above the central pivot |
| Volume by Price | n/a | — | Index with no volume |
| CMF (20) | n/a | — | Index with no volume |
| Force Index (13) | n/a | — | Index with no volume |
| Ulcer Index (14) | 4.56 | medium-high | Collapsed from about 11: the drop from the high has been absorbed |
| Ichimoku Full | 101.53 / 95.34 / 98.44 / 91.85 | 🔴 | MOVE above the Kumo and above the Tenkan and the Kijun; future Kumo green |
| Parabolic SAR | 111.40 | 🟢 | Above the MOVE: short-term downward thrust on volatility |
| Chandelier Exit (22,3) | 100.53 | — | Below the MOVE |
| Aroon (25) | Up 44 / Down 0 | ⚪ | Up falling from 100, Down at zero |
| Correlation vs $USD (20) | −0.26 | − | Weak, collapsed from values close to +0.9 |
| ADX (14) | 31.00 (+DI 32.06 / −DI 18.04) | 🔴 | Confirmed trend, +DI dominant |
| Keltner Channels (20,2,10) | 89.12 / 99.81 / 110.50 | above the midline | Upper half of the channel |
| EMA (20) | 99.81 | Below the MOVE | +3.51% |
| VWAP | n/a | — | Can’t be calculated without volume |
| Stochastic (14,3,3) | 35.16 / 28.10 | ⚪ | Climbing out of the low zone, %K above %D |
| OBV | n/a | — | Index with no volume |
| Williams %R (14) | −56.76 | ⚪ | In the middle zone |
Analytical Commentary
The Compass doesn’t cover the MOVE, so the technical report rests entirely on the four charts, which show a bond market that moved up a level of fear in late September and hasn’t come back down since.
Candlestick. A long-bodied red candle on October 23: open 106.84, high 107.58, close 103.31, low 102.00. The body is about two thirds of the range. The candle gives back part of Thursday’s white one, which had lifted the MOVE from around 96 to 106.84 in a single session: stress spiked in one go, and on Friday only some of the air came out.
Moving Averages. The MOVE sits well above the SMA50 (88.38) and the SMA200 (76.84), with the SMA50 rising steeply. The chart shows a clean regime change: from August to mid-September bond volatility oscillated between 73 and 78, then the late-September jump took it above 95, peaking around 114 in early October. The EMA20 (99.81) tracks the consolidation from below.
Ichimoku Kinko Hyo. The MOVE sits above the Kumo, above the Tenkan (101.53) and the Kijun (95.34), with a green future cloud (Span A 98.44 above Span B 91.85): the structure of stress is bullish. The SAR (111.40) above the MOVE says only that short-term thrust has stalled below the high.
Bands & Levels. The close lands exactly on the Bollinger midline (103.31), with wide bands between 94.72 and 111.89. The MOVE is in the middle of its October range, above the central pivot (98.03) and far from R1 (122.95). The Chandelier (100.53) and the EMA20 (99.81) form the first support band.
Oscillators & Flows. The ADX at 31, with +DI (32.1) above −DI (18.0), says the stress trend is still standing. Momentum, though, has normalized: MACD below its signal line, RSI at 55.8, Ulcer down to 4.6. The ATR at its six-month high says the MOVE itself is moving in jolts. The cross-check that matters is the 10-year Treasury yield. A high MOVE with yields correcting from their high is the combination the interpretive note associates with uncertainty over the rate path, not with fear of further hikes.
🏛️ Pretore signature for the week: Weekly Pretore signature not available (incomplete pipeline snapshots).
🧭 Asset Compass ($MOVE): Compass not available for $MOVE — insufficient history or pipeline snapshot missing.
Detected Patterns
| Pattern | Status |
|---|---|
| Late-September change of level (from 73-78 to above 95) | ✅ Confirmed |
| Sideways consolidation at 95-114 below the early-October high | ✅ Confirmed |
| October 22 spike partly absorbed on the 23rd | ✅ Confirmed |
📌 Operating Scenario
| Item | Description |
|---|---|
| Primary scenario | Elevated bond stress consolidating in the 95-114 range |
| Conditions | Holds above the Kijun (95.34) with no close above the upper Bollinger (111.89) |
| Key support | 100.53-99.81 (Chandelier/EMA20) → 98.03 (pivot) → 95.34-94.72 (Kijun/lower Bollinger) |
| Key resistance | 107.58 (Friday’s high) → 111.40-111.89 (SAR/upper Bollinger) → 114 area (high) |
| Warning level | Close below 94.72: stress starts to ease back toward the SMA50 |
| Estimated timing | Resolution within 1-3 weeks |
BIAS: NEUTRAL (on the stress level) — Bond volatility high and stable in its new range. Above 111.89 stress flares up again; below 94.72 it starts to ease.
🎯 FINBEAR Verdict
Direction: 🔴 High bond stress, consolidating
| Scenario | Trigger | Target | Note |
|---|---|---|---|
| ▶▶▶ CENTRAL THESIS — High stress, stabilized | MOVE between 94.72 and 111.89 | Range 95-114 | ADX above 25, momentum normalized |
| ▶▶ ALTERNATIVE SCENARIO — Stress flares up again | Close above 111.89 | 114 area → 122.95 (R1) | Requires clearing the SAR |
| ▶ TAIL SCENARIO — Stress eases | Close below 94.72 | 88.38 (SMA50) → 85.53 (S1) | Only if the Kijun and the lower Bollinger give way |
📡 Operating levels, decision dashboard and summary verdict for this asset → CTM Signal™
📎 The MOVE chart says the bond market is paying far more today for insurance against rate shocks than it did in the summer, and that the premium didn’t come down even when the 10-year yield started to retrace. What the chart doesn’t say is where the fear comes from: the Fed’s path, Treasury supply, the inflation that oil is putting back into circulation. Those are questions for the RADAR Pro Elite. When bonds shake, equities tend to be the last to find out: watch only the VIX and you’re reading half the thermometer.
📈 Technical Charts — $MOVE
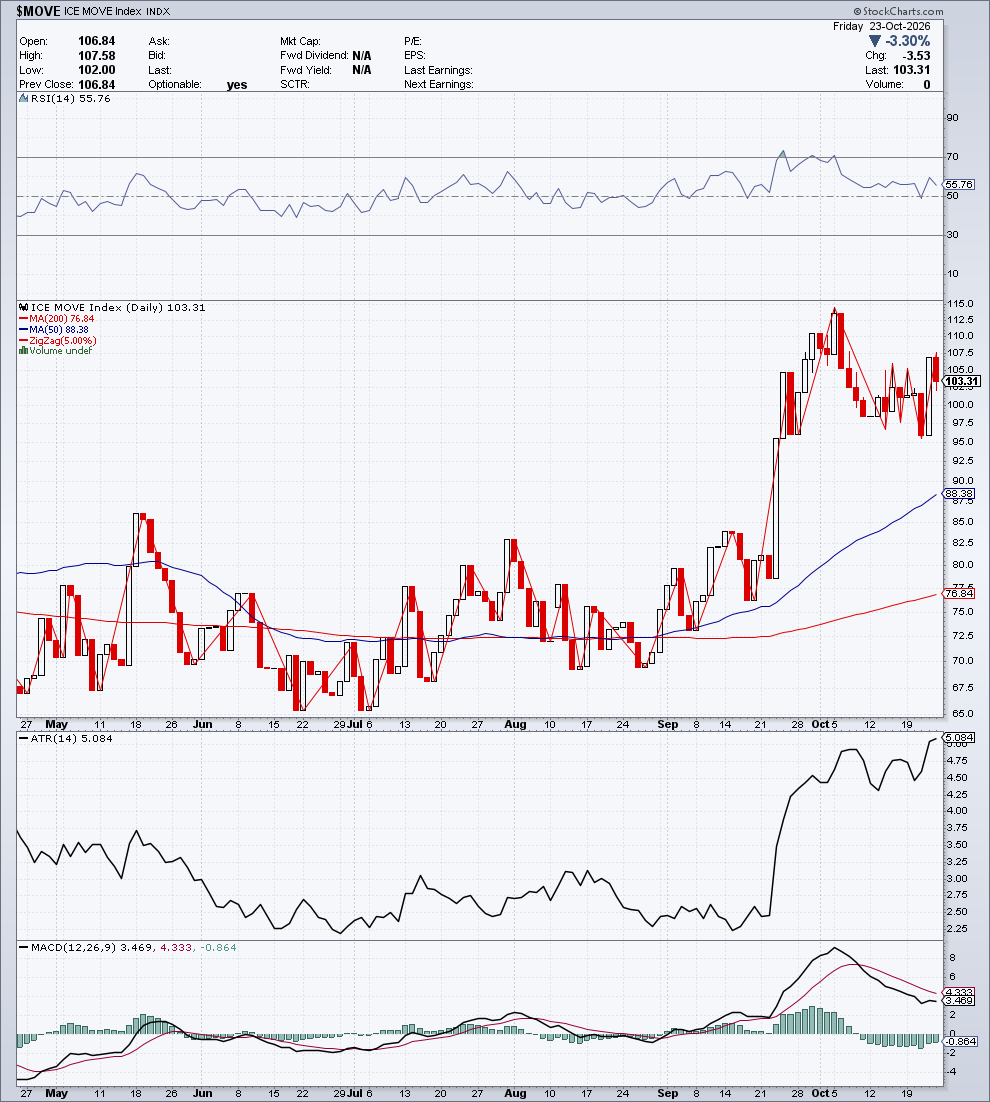
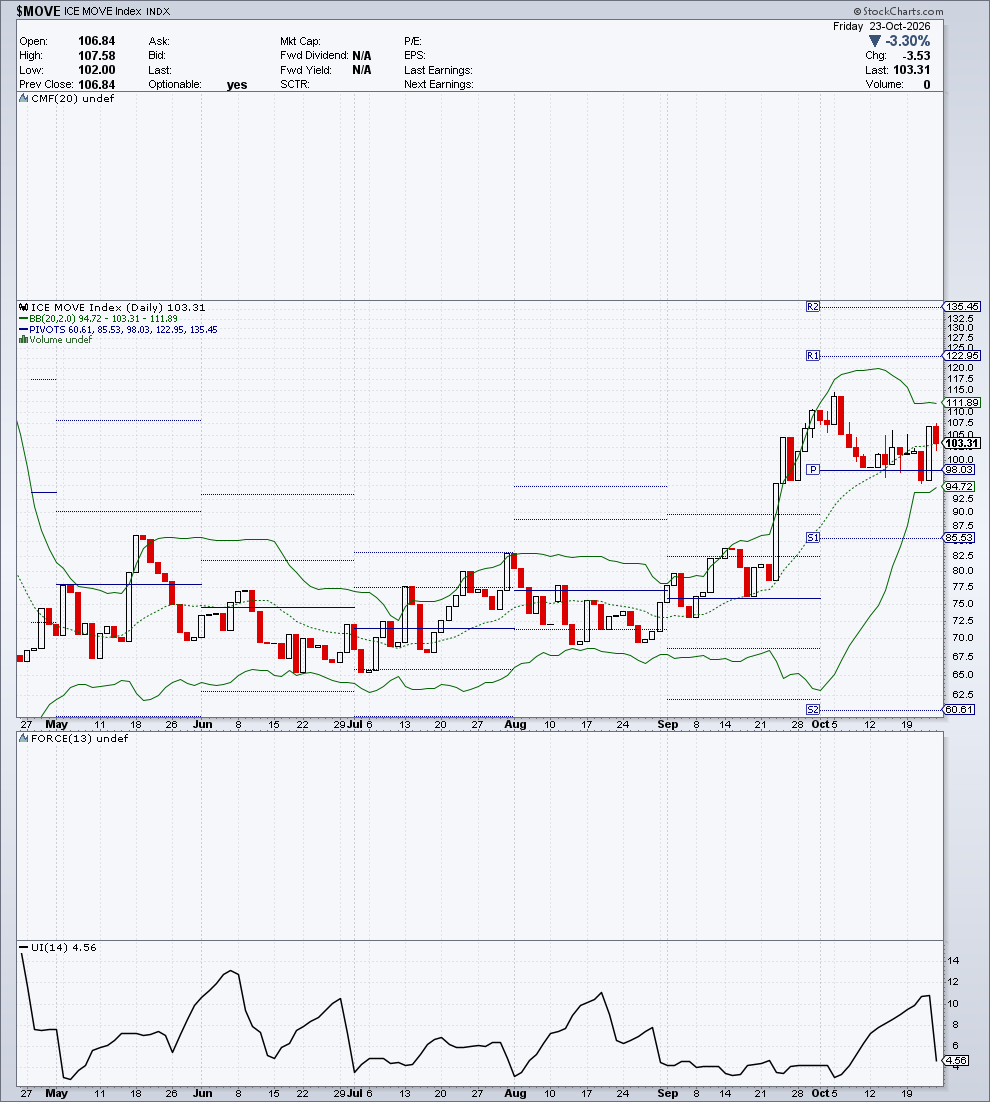
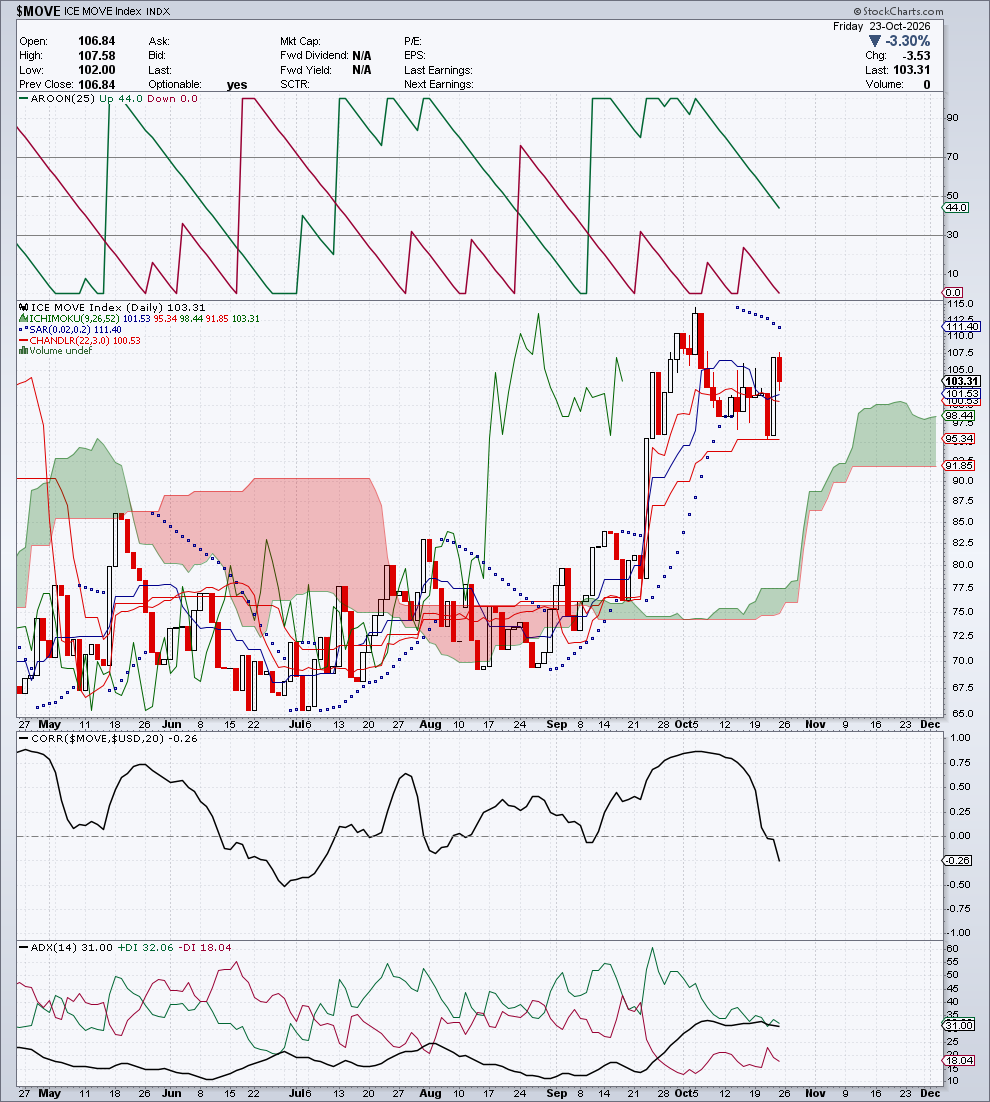
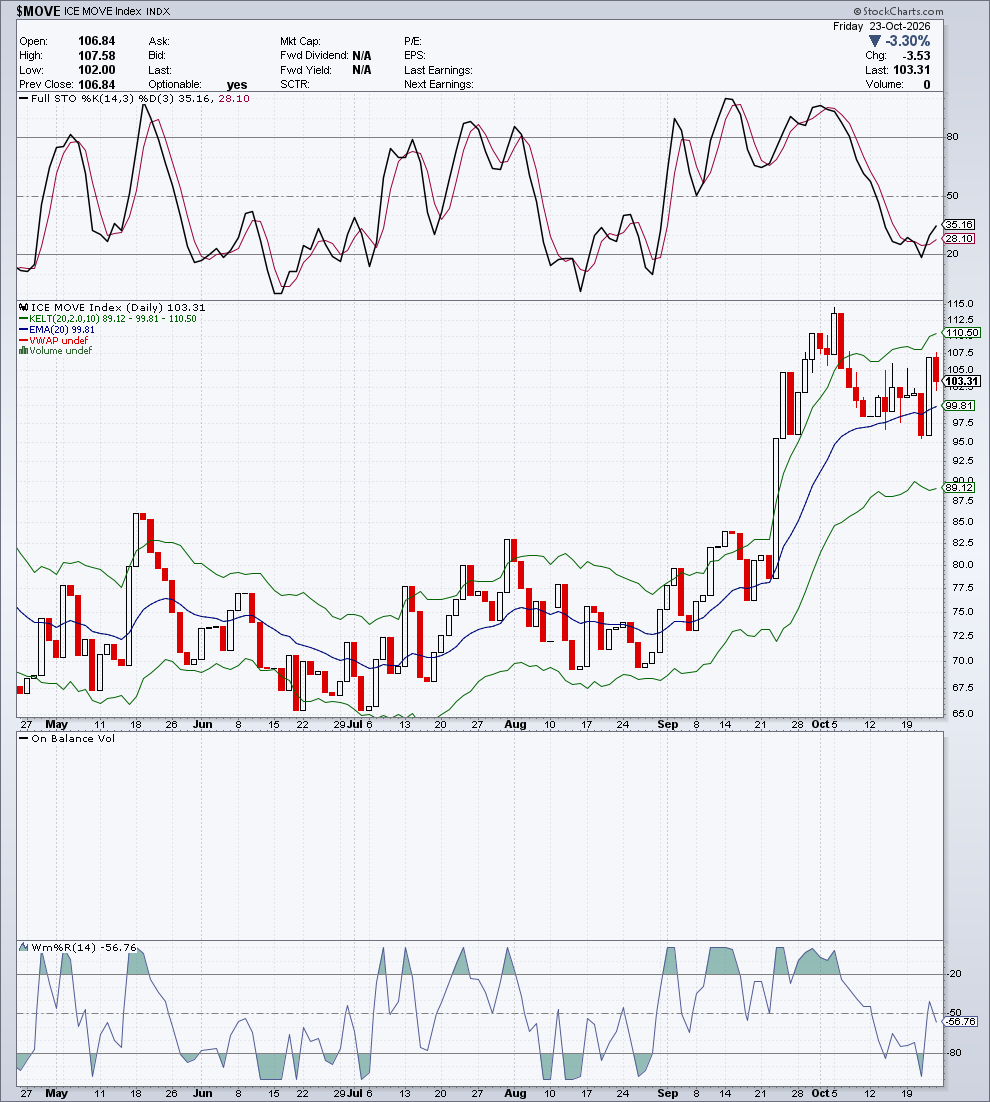
Section produced for Module C — FINBEAR™ Strategic Report — October 24, 2026
⚖️ Cross Comparison — Currencies & Rates
| Parameter | USD | EURUSD | TNX | MOVE | Leader |
|---|---|---|---|---|---|
| Session change | +0.18% | −0.14% | +0.71% | −3.30% | MOVE (falling) |
| RSI(14) | 55.32 | 35.18 | 40.71 | 55.76 | MOVE |
| ADX (+DI/−DI) | 37.56 (21.29/16.46) | 46.94 (11.11/25.89) | 30.27 (22.45/27.55) | 31.00 (32.06/18.04) | EURUSD (strength, −DI) |
| Position vs Kumo | above | below | above (but below Tenkan/Kijun) | above | USD |
| CMF(20) | n/a | n/a | n/a | n/a | — |
| Bias | NEUTRAL-POSITIVE | NEUTRAL-WEAK | NEUTRAL-WEAK (on the yield) | NEUTRAL (on the stress level) | USD |
Reading: The dollar runs the currency side: $USD with ADX 37.6 and +DI dominant, $EURUSD with the highest ADX in the entire panel (46.9) but with −DI in control, boxed into a sideways base between 1.113 and 1.127. The correlation of −0.85 between the two says there’s no story here other than the dollar. On rates the split is between level and volatility. $TNX is pulling back to its SMA50 (4.984%) with −DI crossing above +DI, while $MOVE stays in an uptrend at 103.31, well above its averages. Yields are falling, but the bond market is paying more than before to insure itself.
PART III — COMMODITIES
📊 Spot Gold ($GOLD) — 3,994.60
Date: Friday, October 23, 2026 | Change: −30.22 (−0.75%) | Volume: n/a (spot)
Daily range: 3,975.65 – 4,038.49 | Prev. Close: 4,024.82
Indicator Table
| Indicator | Value | Signal | Notes |
|---|---|---|---|
| Trend | Bearish | 🔴 | Price < SMA50 < SMA200; lower highs since late August |
| SMA 200 | 4,512.56 | Above price | −11.48% |
| SMA 50 | 4,301.25 | Above price | −7.13% |
| Zig Zag (2.81%) | high ~4,700 (late Aug) → 3,994.60 | — | Stepwise decline, new low for the period |
| RSI (14) | 33.40 | 🔴 | On the edge of oversold |
| MACD (12,26,9) | −57.39 / −49.55 | 🔴 | Histogram −7.84, line below the signal line |
| ATR (14) | 76.67 | ↓ | Volatility contracting since September, picking up over the last two sessions |
| Bollinger (20,2) | 4,038.75 / 4,135.89 / 4,233.03 | below lower band | Close outside the lower band |
| Pivot Points | S2 3,859.97 · S1 4,008.88 · P 4,259.92 · R1 4,408.83 · R2 4,659.87 | below S1 | S1 lost on the close |
| Volume by Price | n/a | — | Spot, no volume |
| CMF (20) | n/a | — | Spot, no volume |
| Force Index (13) | n/a | — | Spot, no volume |
| Ulcer Index (14) | 1.95 | low | Recent drawdown contained, but rising |
| Ichimoku Full | 4,088.15 / 4,187.70 / 4,137.92 / 4,336.47 | 🔴 | Price below the Kumo; future cloud red |
| Parabolic SAR | 4,164.64 | 🔴 | Above price |
| Chandelier Exit (22,3) | 4,067.94 | 🔴 | Price below: the exit for long positions has already triggered |
| Aroon (25) | Up 0 / Down 100 | 🔴 | Complete bearish dominance |
| Correlation vs $USD (20) | 0.25 | + | Jump from −0.75: the inverse link with the dollar has switched off |
| ADX (14) | 23.23 (+DI 10.91 / −DI 29.96) | 🔴 | Trend forming, −DI clearly dominant and rising |
| Keltner Channels (20,2,10) | 4,003.57 / 4,149.44 / 4,295.31 | below lower band | Double exit: Bollinger and Keltner |
| EMA (20) | 4,149.44 | Above price | −3.73% |
| VWAP | n/a | — | Spot, no volume |
| Stochastic (14,3,3) | 18.64 / 29.85 | 🟠 | Oversold, %K below %D |
| OBV | n/a | — | Spot, no volume |
| Williams %R (14) | −92.16 | 🟠 | Extreme oversold |
Analytical Commentary
Quantitative frame. Gold’s Compass records a strong, coherent bearish operating regime, but with reliability suspended. The signal is scattered, and the statistics can’t carry the judgment on their own. Within that frame, the four technical layers have to say whether the decline is orderly or accelerating. Friday’s answer: the latter.
Candlestick. A full-bodied red candle: open at the high (4,038.49), a slide to 3,975.65, a close at 3,994.60. The body takes up 70% of the range, with no upper shadow: not a single buyer turned up at the open. It’s the second straight selling session, and it takes gold below 4,000 for the first time since July, out of the 4,070-4,200 congestion that had held all through October.
Moving Averages. A complete bearish structure: price below the SMA50 (4,301.25, −7.13%), below the SMA200 (4,512.56, −11.48%) and below the EMA20 (4,149.44). The SMA50 has rolled over and stays below the SMA200, and the chart shows a string of lower highs from the late-August peak (~4,700), with every October bounce stopped short of 4,200.
Ichimoku Kinko Hyo. Price below the Kumo, which turns red as it projects forward (Span A 4,137.92 below Span B 4,336.47). Tenkan (4,088.15) below Kijun (4,187.70), SAR above price (4,164.64), Chandelier at 4,067.94 already breached: every trend tool points the same way.
Bands & Levels. A close below the lower Bollinger band (4,038.75) and below the lower Keltner (4,003.57) — a double exit from the channel, which in a downtrend confirms thrust rather than exhaustion. The S1 pivot (4,008.88) gave way on the close; the next reference is S2 at 3,859.97, with the area of the late-June and July lows, around 3,940, in between.
Oscillators & Flows. RSI 33.40, Stochastic 18.64/29.85, Williams %R −92.16: the short-term oscillators are oversold, and the RSI is one step away. MACD below its signal line with a negative histogram, Aroon 0/100, −DI at 29.96 against +DI at 10.91 with the ADX rising to 23.23. The direction is clear and the strength is building. On flows, spot offers nothing, because it has no volume. One detail deserves attention: the correlation with the dollar has jumped from −0.75 to +0.25, so gold is falling without any strong tie to the dollar.
🏛️ Pretore signature for the week:
- Mon:
active long→ Fri:active short— Δ flip - Operational stop, Friday close (pipeline futures series): 4,041.76
🧭 Asset Compass ($GOLD) · Friday close, October 23, 2026
  VERDICT           CONFIRMED        — recent momentum confirms
  OPERATING REGIME  STRONG BEAR
  LINEARITY         Non-linear trends
  COHERENCE         FULL
  RELIABILITY       SUSPENDED
  POSITION          -- below trend   — below the underlying trend
  UNDERLYING TREND  Structural bear  — unreliable
Quantitative reading of the asset’s regime: the box is based on the futures series; the price shown here is spot. The trend can’t be read with confidence. The signal is scattered, and the Compass says wait, don’t bet on where it goes. Recent momentum confirms the bear and price sits below the underlying trend, but that reference is weak too and should be read with caution. It’s the four layers’ qualitative reading, not the statistics, that sets the week’s direction.
Detected Patterns
| Pattern | Status |
|---|---|
| Lower highs since the late-August peak | ✅ Confirmed |
| Downside break of the October congestion (4,070-4,200) | ✅ Confirmed |
| Close outside the lower Bollinger and Keltner bands | ✅ Confirmed |
| Oversold on Stochastic and Williams %R | ✅ Confirmed |
📌 Operating Scenario
| Item | Description |
|---|---|
| Primary scenario | The decline continues toward the area of the summer lows |
| Conditions | Closes below 4,008.88 (S1) and a failure to get back inside the Bollinger band |
| Key support | 3,975.65 (Friday’s low) → 3,940 area (June-July lows) → 3,859.97 (S2) |
| Key resistance | 4,008.88 (S1) → 4,038.75 (lower Bollinger) / 4,041.76 (Pretore invalidation, futures) → 4,067.94 (Chandelier) → 4,097.16 → 4,149.44 (EMA20) |
| Warning level | Futures close above 4,041.76: the bearish signature is invalidated; above 4,097 price is back inside the October congestion |
| Estimated timing | 1-2 weeks |
BIAS: BEARISH — Every layer points down and the ADX is rising. Oversold makes technical bounces likely, but as long as the futures stay below 4,041.76 they are bounces inside a bear.
🎯 FINBEAR Verdict
Direction: 🔴 Bear, accelerating
| Scenario | Trigger | Target | Note |
|---|---|---|---|
| ▶▶▶ CENTRAL THESIS — Bearish continuation | Closes below 4,008.88 (S1) | 3,940 area → 3,859.97 (S2) | ADX rising, −DI dominant |
| ▶▶ ALTERNATIVE SCENARIO — Oversold bounce | Recovery of 4,038.75 (lower Bollinger) | 4,097-4,149 (resistance / EMA20) | Stochastic and Williams stretched |
| ▶ TAIL SCENARIO — Reversal | Close above 4,259.92 (pivot P) | 4,301.25 (SMA50) | Requires a move back above the Kumo |
📡 Operating levels, decision dashboard and summary verdict for this asset → CTM Signal™
📎 Gold punched through 4,000 on its way out of a month of congestion, and it did so just as the inverse correlation with the dollar went dark. The chart says the selling isn’t tracking the currency closely; it doesn’t say why. Real yields, oil muscling in on the safe-haven role, profit-taking on a metal that had run for years: that game is played in the RADAR Pro Elite. What’s left here is a clear-cut technical verdict: this week, the safe haven didn’t show up for work.
📈 Technical Charts — $GOLD
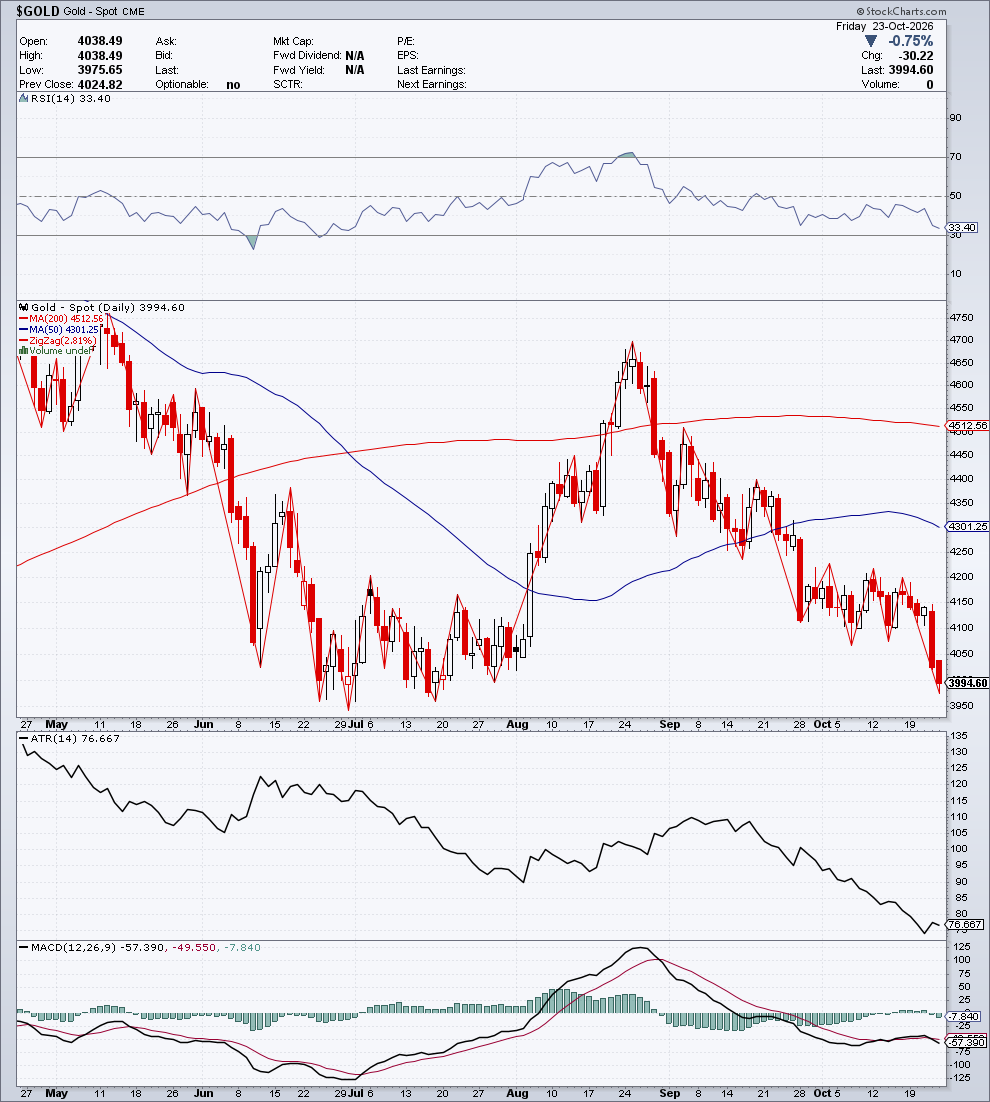
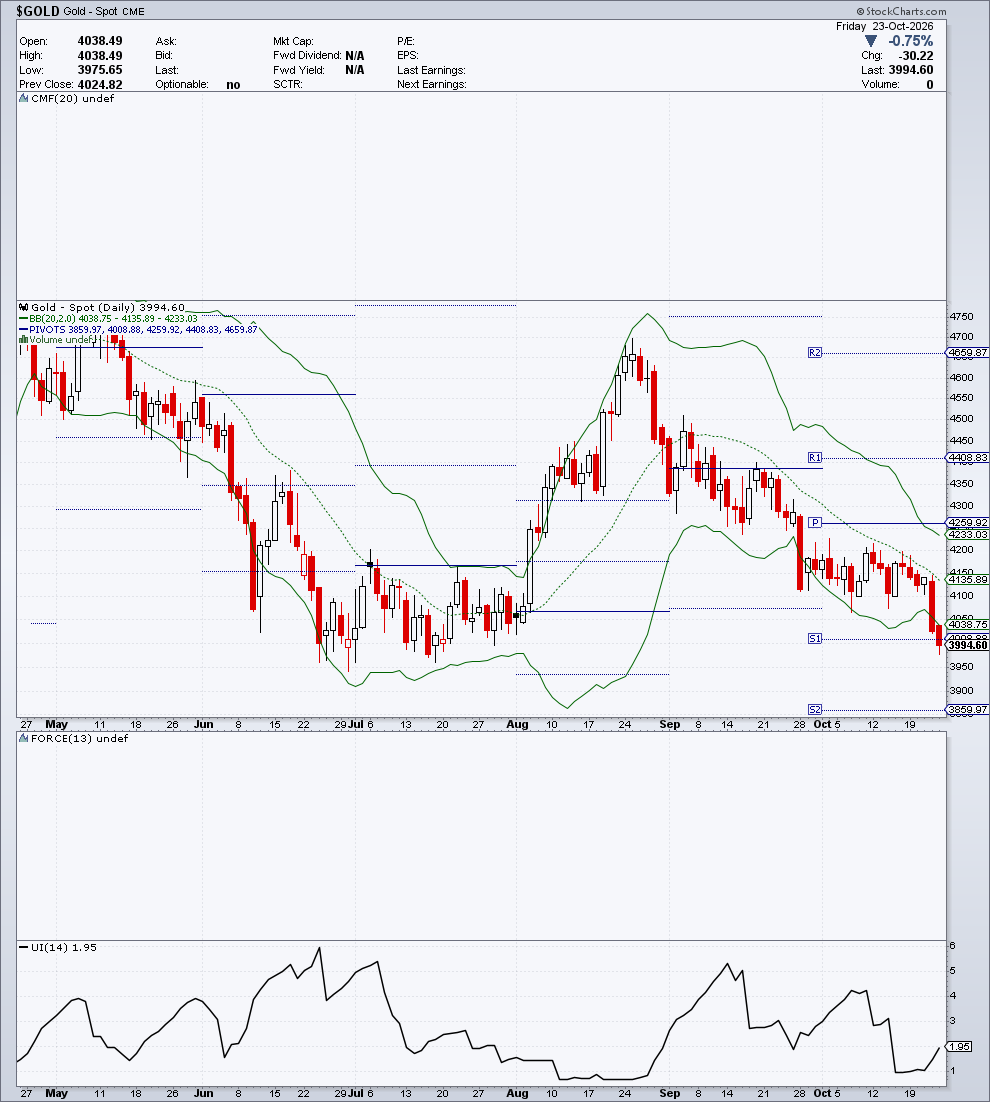
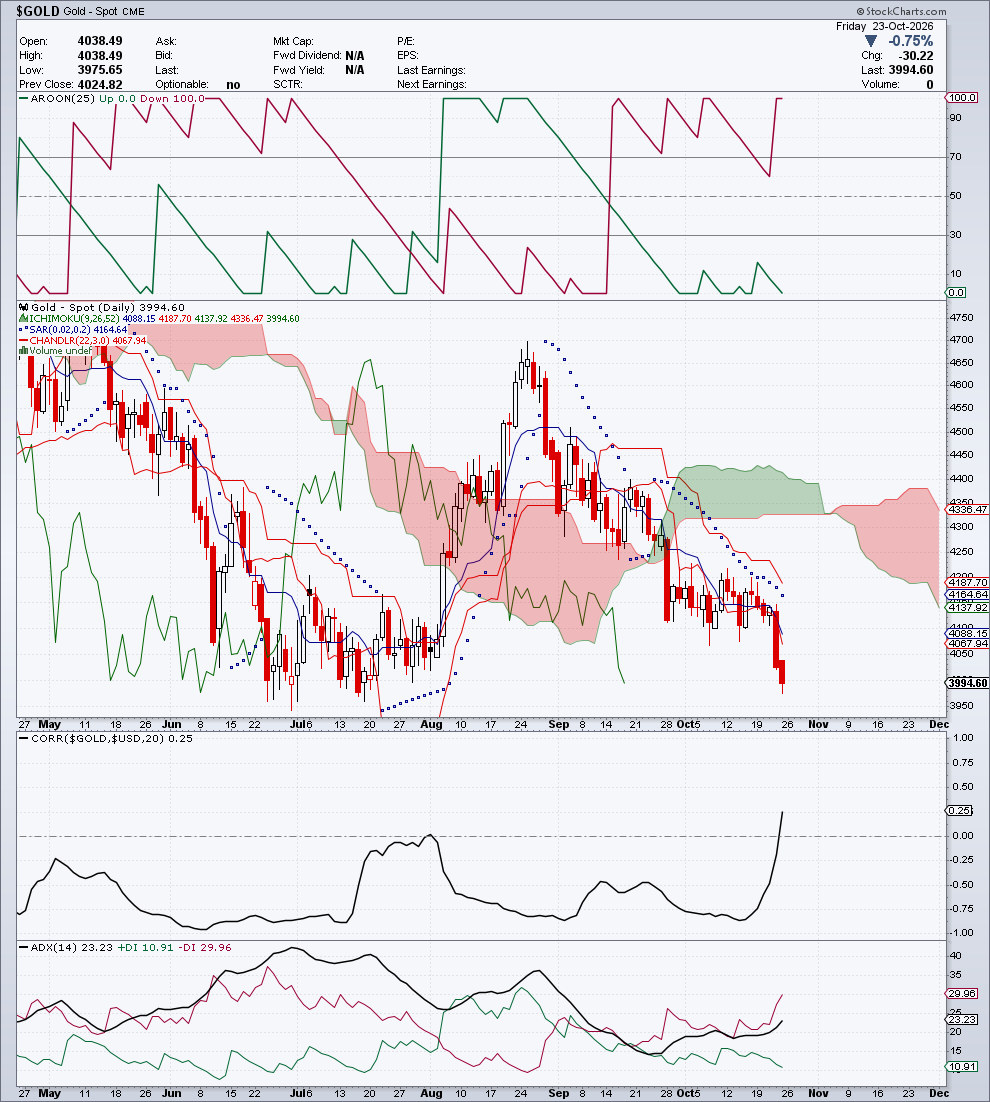
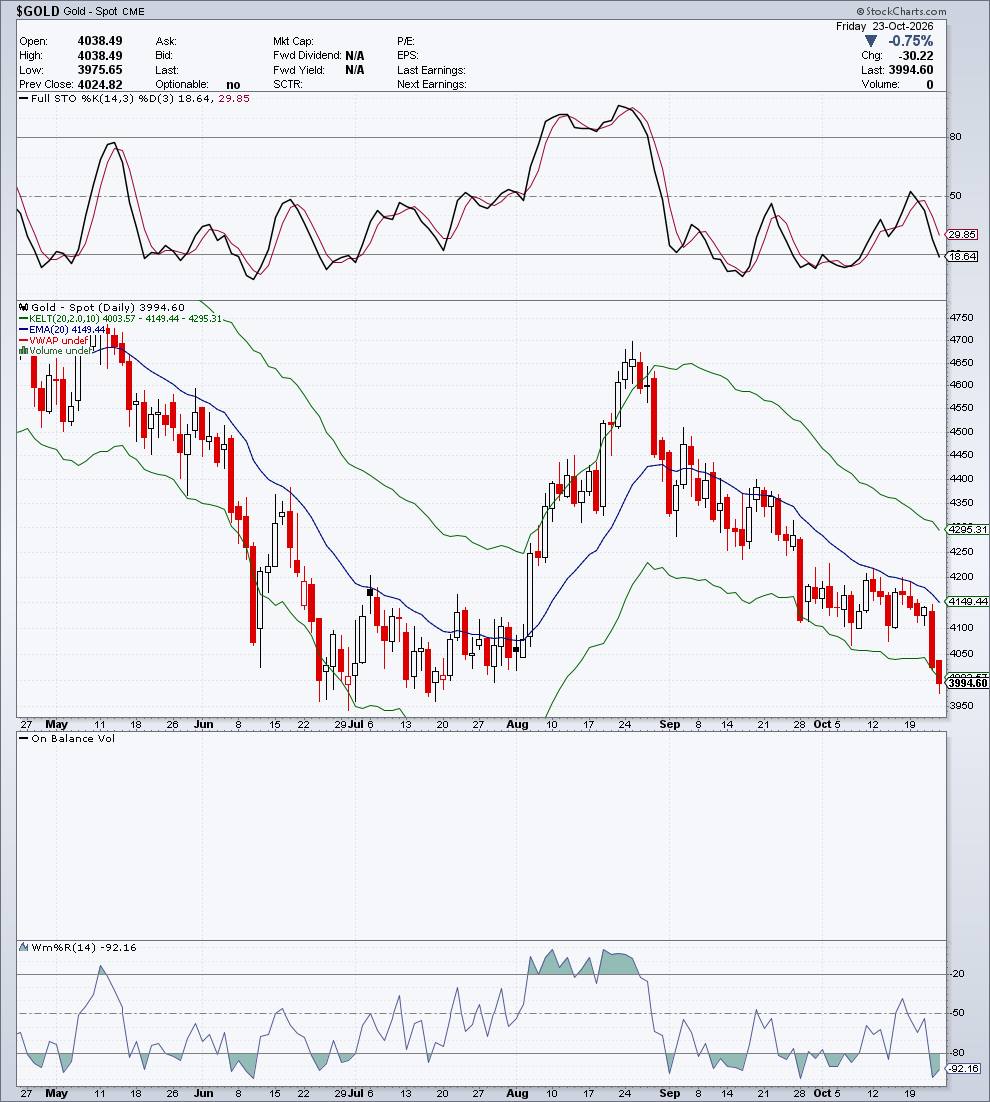
Section produced for Module C — FINBEAR™ Strategic Report — October 24, 2026
📊 Spot Silver ($SILVER) — 53.88
Date: Friday, October 23, 2026 | Change: −0.71 (−1.29%) | Volume: n/a (spot)
Daily range: 53.83 – 54.62 | Prev. Close: 54.59
Indicator Table
| Indicator | Value | Signal | Notes |
|---|---|---|---|
| Trend | Bearish | 🔴 | Price < SMA50 < SMA200; new low for the period |
| SMA 200 | 71.70 | Above price | −24.85% |
| SMA 50 | 63.04 | Above price | −14.53% |
| Zig Zag (5.00%) | high ~71 (late Aug) → 53.88 | — | Below the July lows (~55) |
| RSI (14) | 31.24 | 🔴 | On the oversold threshold |
| MACD (12,26,9) | −2.095 / −1.738 | 🔴 | Histogram −0.357, line below the signal line |
| ATR (14) | 2.091 | ↓ | At its lowest since May: a decline without lurches |
| Bollinger (20,2) | 54.37 / 58.82 / 63.27 | below lower band | Close outside the lower band |
| Pivot Points | S2 54.62 · S1 57.51 · P 62.91 · R1 65.81 · R2 71.21 | below S2 | Every monthly support lost |
| Volume by Price | n/a | — | Spot, no volume |
| CMF (20) | n/a | — | Spot, no volume |
| Force Index (13) | n/a | — | Spot, no volume |
| Ulcer Index (14) | 6.50 | medium-high | Rising: drawdown stress is building again |
| Ichimoku Full | 57.28 / 60.68 / 58.98 / 62.50 | 🔴 | Price well below the Kumo |
| Parabolic SAR | 58.52 | 🔴 | Above price |
| Chandelier Exit (22,3) | 58.42 | 🔴 | Price below: the exit for long positions has already triggered |
| Aroon (25) | Up 8 / Down 100 | 🔴 | Bearish dominance |
| Correlation vs $USD (20) | 0.07 | ≈0 | From −0.75 to zero in a few sessions: no strong link with the dollar |
| ADX (14) | 30.04 (+DI 9.94 / −DI 30.51) | 🔴 | Confirmed downtrend, ADX and −DI rising |
| Keltner Channels (20,2,10) | 54.67 / 58.71 / 62.75 | below lower band | Double exit from the channels |
| EMA (20) | 58.71 | Above price | −8.23% |
| VWAP | n/a | — | Spot, no volume |
| Stochastic (14,3,3) | 14.44 / 26.37 | 🟠 | Oversold, %K falling |
| OBV | n/a | — | Spot, no volume |
| Williams %R (14) | −99.32 | 🟠 | Close practically on the 14-session low |
Analytical Commentary
Quantitative frame. As with gold, the Compass records a strong, coherent bearish operating regime with reliability suspended. Here, though, the four technical layers leave no room for interpretation: silver is the weakest metal in the panel, and every indicator says so.
Candlestick. A bearish marubozu: open at the high (54.62), close at 53.88, a whisker above the low (53.83). No upper shadow and next to no lower shadow — a sell-only session from the first tick to the last. Price closes below the July lows, around 55, and marks the lowest point on the whole chart.
Moving Averages. Silver sits a quarter below its SMA200 (71.70, −24.85%) and almost 15% below its SMA50 (63.04). The SMA50 has been falling since mid-September and crossed below the 200 back in the summer. Every attempt to climb in October stalled below 62: this is the structure of a market that sells the rallies.
Ichimoku Kinko Hyo. Price below the Kumo by a wide margin (Span B at 62.50), Tenkan (57.28) below Kijun (60.68), SAR (58.52) and Chandelier (58.42) above price. The projected cloud turns red, and the Ichimoku picture offers no handholds.
Bands & Levels. A close below the lower Bollinger (54.37), below the lower Keltner (54.67) and below the S2 pivot (54.62): every monthly support has been used up. Below price, there are no reference levels anywhere on the chart. The ATR at its lowest since May (2.091) says the decline isn’t the product of a sudden crash but of methodical selling, day after day.
Oscillators & Flows. RSI 31.24, Stochastic 14.44/26.37, Williams %R −99.32: fully oversold in the short term. But the ADX at 30.04, with −DI at 30.51 against +DI at 9.94, and Aroon Down at 100 say the trend is strong and confirmed. In a bear with the ADX above 30, oversold can last. Flows aren’t available on spot. As with gold, the correlation with the dollar has dropped to zero.
🏛️ Pretore signature for the week:
- Mon:
active long→ Fri:active short— Δ flip - Operational stop, Friday close (pipeline futures series): 53.9555
🧭 Asset Compass ($SILVER) · Friday close, October 23, 2026
  VERDICT           CONFIRMED        — recent momentum confirms
  OPERATING REGIME  STRONG BEAR
  LINEARITY         Ordinary trends
  COHERENCE         FULL
  RELIABILITY       SUSPENDED
  POSITION          -- below trend   — below the underlying trend
  UNDERLYING TREND  Structural bear  — unreliable
Quantitative reading of the asset’s regime: the box is based on the futures series; the price shown here is spot. The trend can’t be read with confidence. The signal is scattered, and the Compass says wait, don’t bet on where it goes. Recent momentum and a position below the underlying trend confirm the bear, but against a weak structural reference that should be read with caution. The four technical layers set the direction, and here they’re unanimous.
Detected Patterns
| Pattern | Status |
|---|---|
| Break of the July lows (55 area) | ✅ Confirmed |
| Bearish marubozu at the low | ✅ Confirmed |
| Lower highs since late August | ✅ Confirmed |
| Oversold on Stochastic and Williams %R | ✅ Confirmed |
📌 Operating Scenario
| Item | Description |
|---|---|
| Primary scenario | The decline continues into an area with no recent chart references |
| Conditions | Closes below 53.83 and a failure to get back above 54.62 (S2) |
| Key support | 53.83 (Friday’s low) → n/a (no level visible anywhere on the chart) |
| Key resistance | 53.96 (Pretore invalidation, futures) → 54.37-54.67 (Bollinger, S2, Keltner) → 57.13 / 57.51 (S1) → 58.71 (EMA20) |
| Warning level | Futures close above 53.96: the bearish signature is invalidated; above 54.62 price is back inside the channel |
| Estimated timing | 1-2 weeks |
BIAS: BEARISH — A strong, confirmed bear (ADX 30). The oversold reading is real, but with −DI at three times +DI it is, for now, a symptom of the decline’s strength, not of its end.
🎯 FINBEAR Verdict
Direction: 🔴 Strong bear, the weakest metal in the panel
| Scenario | Trigger | Target | Note |
|---|---|---|---|
| ▶▶▶ CENTRAL THESIS — Bearish continuation | Closes below 53.83 | n/a — no support anywhere on the chart | ADX 30, Aroon Down 100 |
| ▶▶ ALTERNATIVE SCENARIO — Oversold bounce | Back above 54.62 (S2) | 57.13-57.51 (resistance / S1) | Williams %R at −99 |
| ▶ TAIL SCENARIO — Reversal | Close above 58.71 (EMA20) | 60.68 (Kijun) | Requires SAR and Chandelier to be cleared |
📡 Operating levels, decision dashboard and summary verdict for this asset → CTM Signal™
📎 Silver has slid to a quarter below its long-term average, and on Friday it closed on the low without putting up a minute’s fight. The chart measures the wound precisely; the reason lives in the RADAR Pro Elite, because it’s about the metal’s split personality, half safe haven and half industrial input, and which of the two is giving way. One thing the chart does say clearly: anyone waiting for the oversold bounce is buying an opinion, not a signal.
📈 Technical Charts — $SILVER
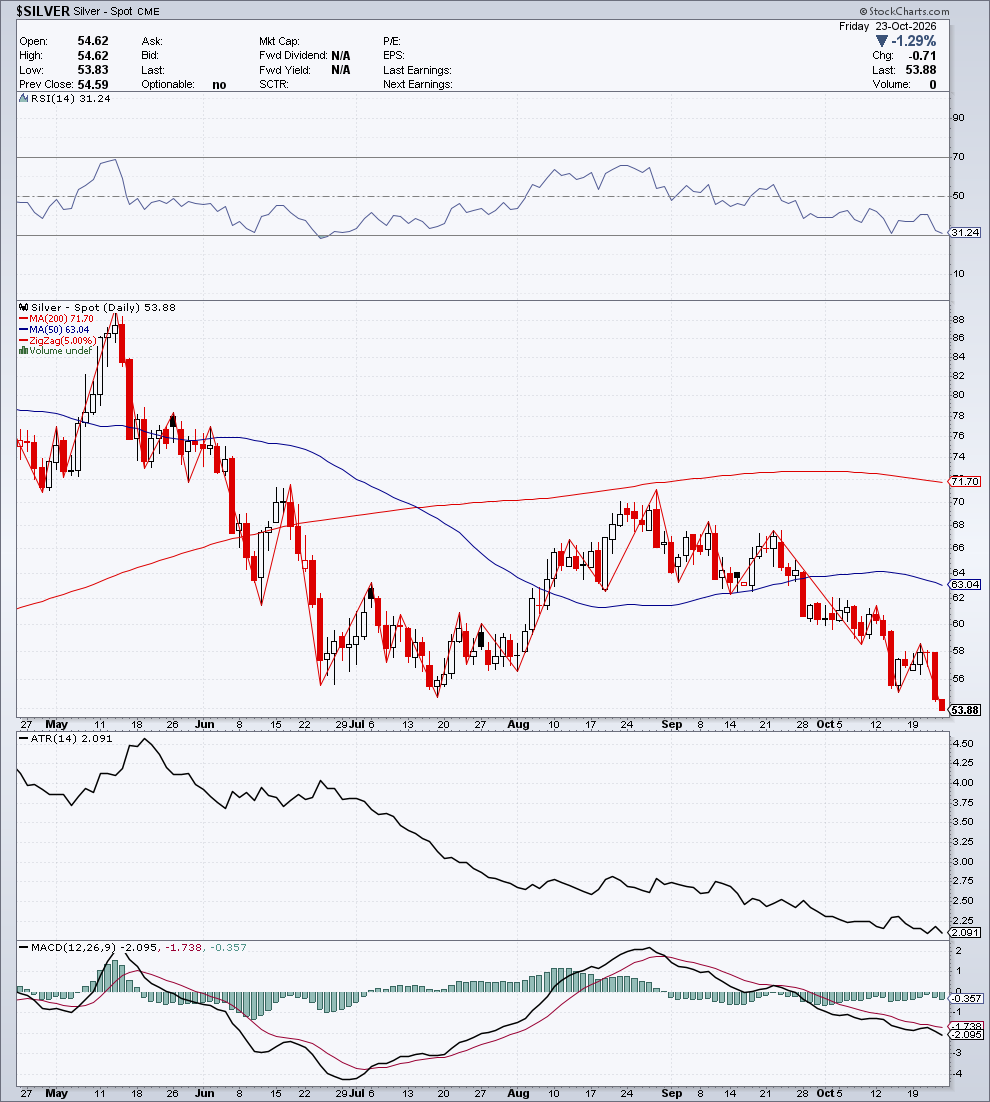
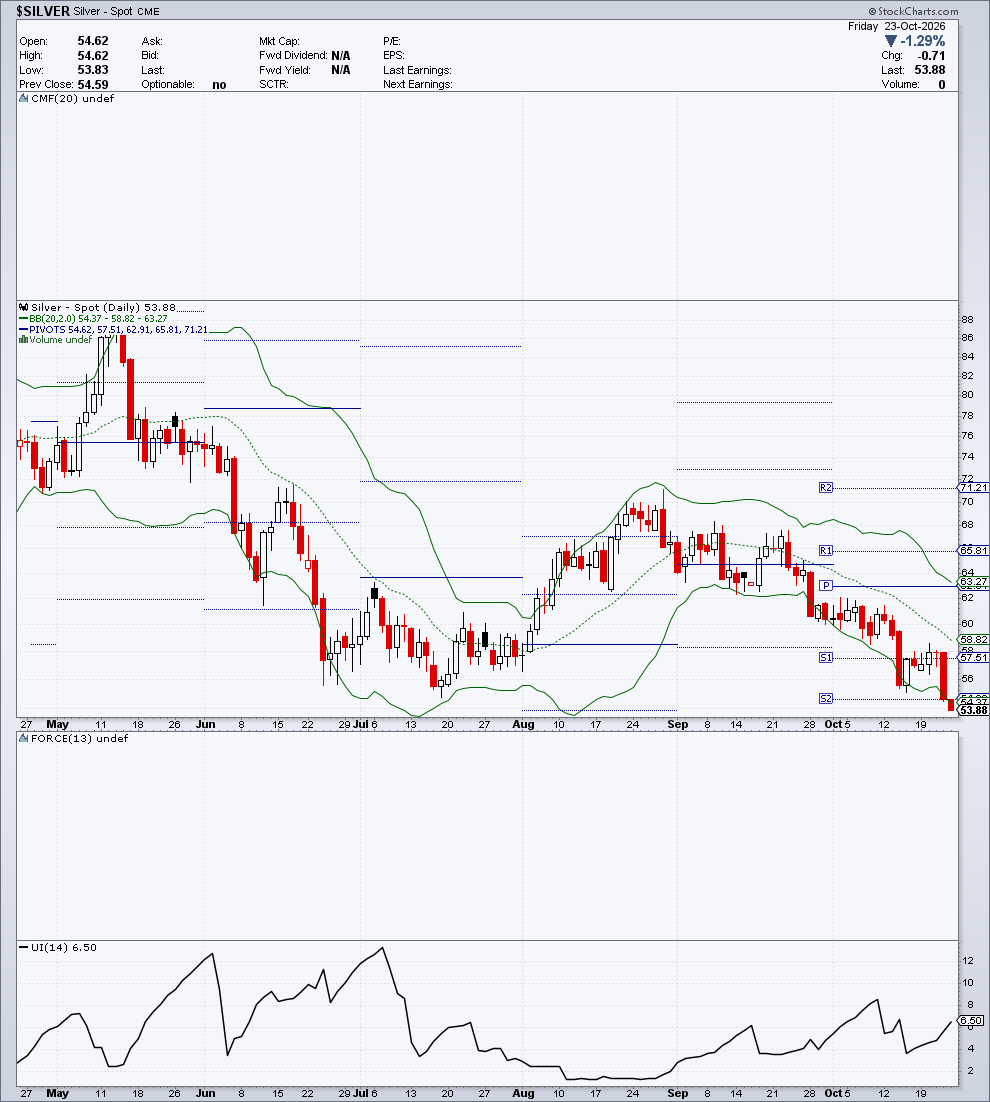
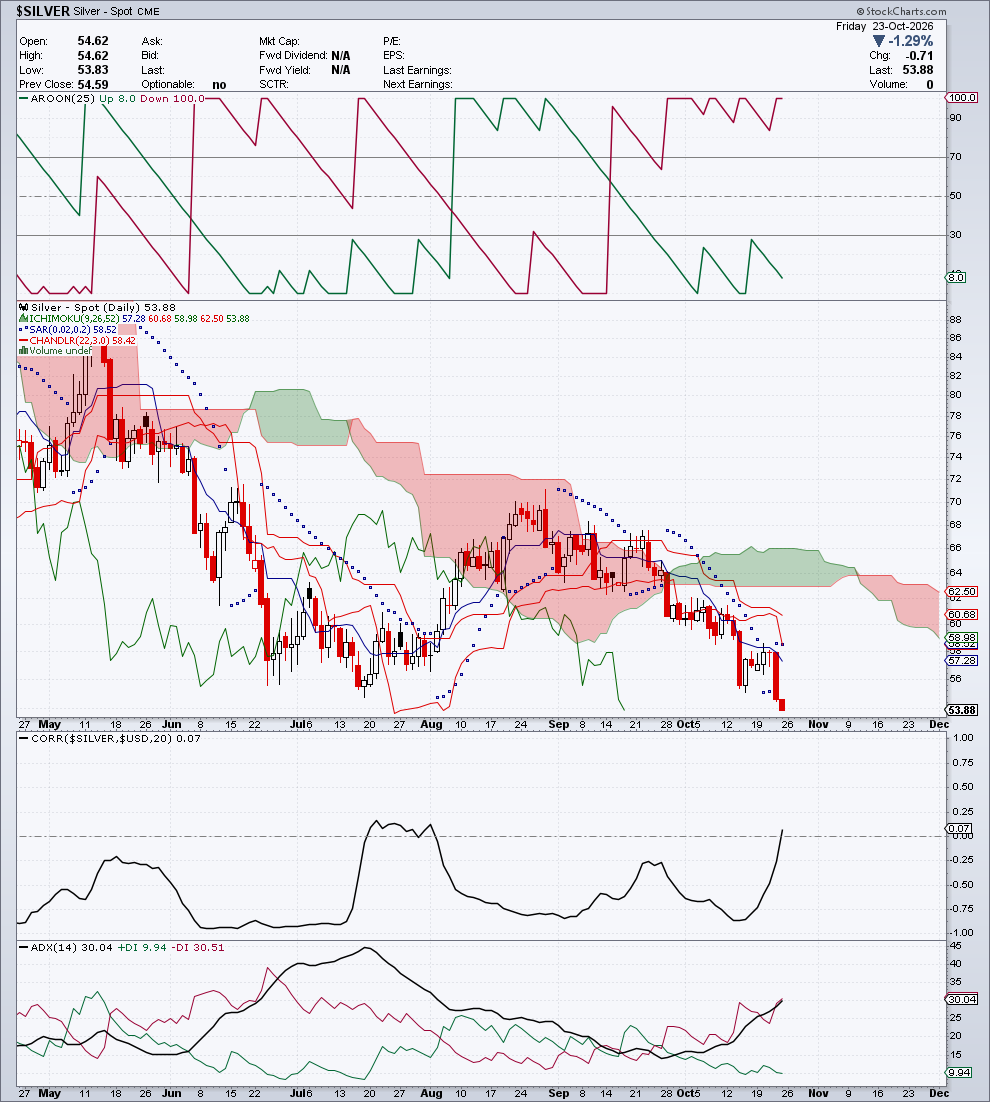
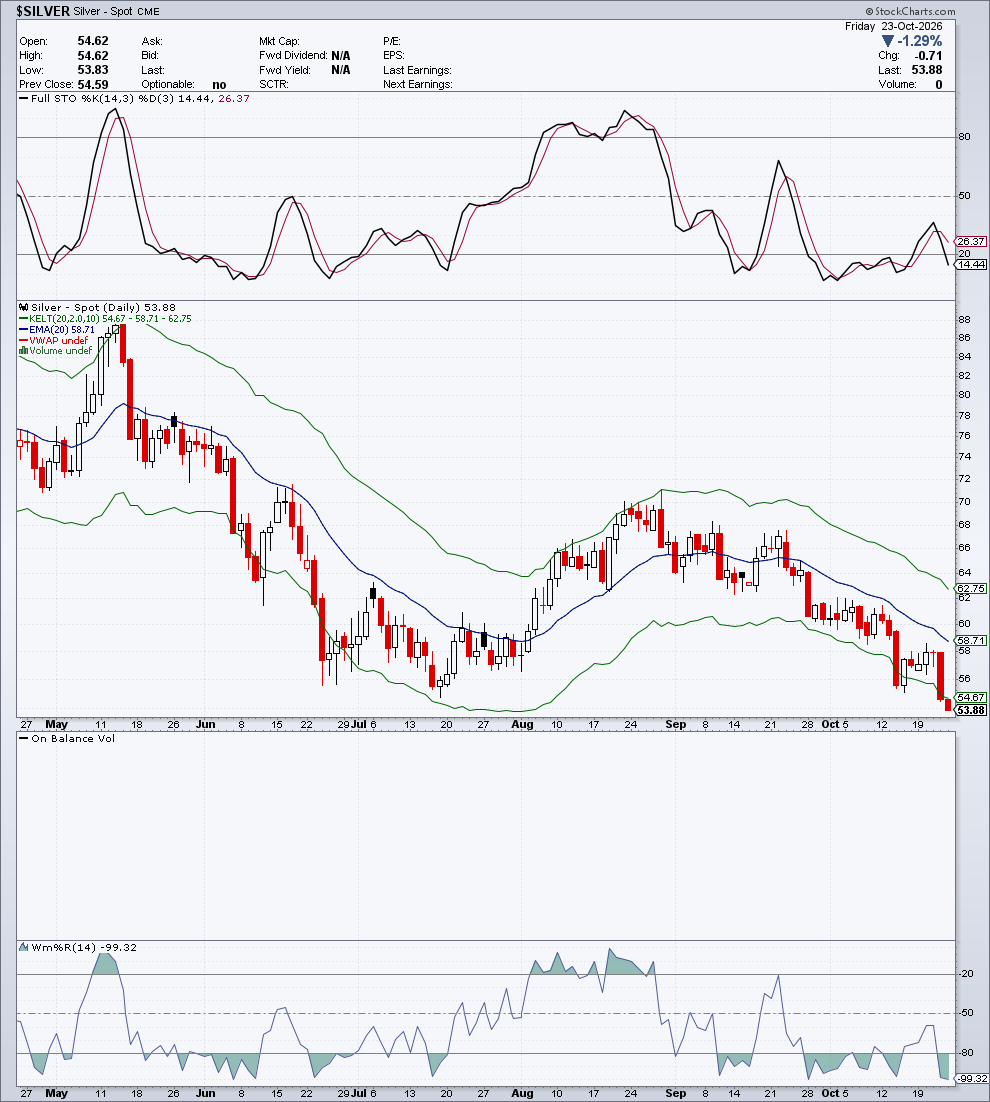
Section produced for Module C — FINBEAR™ Strategic Report — October 24, 2026
📊 Spot Copper ($COPPER) — 6.465
Date: Friday, October 23, 2026 | Change: +0.103 (+1.62%) | Volume: n/a (spot)
Daily range: 6.463 – 6.477 | Prev. Close: 6.363
Indicator Table
| Indicator | Value | Signal | Notes |
|---|---|---|---|
| Trend | Sideways (correction within the range) | ⚪ | Price between SMA200 and SMA50 |
| SMA 200 | 6.19 | Below price | +4.44% |
| SMA 50 | 6.57 | Above price | −1.60% |
| Zig Zag (3.75%) | high ~6.82 (Sep 22) → low ~6.36 (Oct 22) → 6.465 | — | Bounce off the October cycle low |
| RSI (14) | 44.76 | ⚪ | Neutral, rising |
| MACD (12,26,9) | −0.025 / −0.005 | 🔴 | Histogram −0.019, line below the signal line |
| ATR (14) | 0.081 | → | Low volatility, edging up |
| Bollinger (20,2) | 6.41 / 6.55 / 6.70 | lower half | Back above the lower band |
| Pivot Points | S2 6.01 · S1 6.28 · P 6.56 · R1 6.83 · R2 7.11 | between S1 and P | Below the central pivot |
| Volume by Price | n/a | — | Spot, no volume |
| CMF (20) | n/a | — | Spot, no volume |
| Force Index (13) | n/a | — | Spot, no volume |
| Ulcer Index (14) | 2.23 | low | Contained drawdown |
| Ichimoku Full | 6.52 / 6.59 / 6.56 / 6.56 | ⚪ | Price back inside the Kumo, below Tenkan and Kijun |
| Parabolic SAR | 6.76 | 🔴 | Above price |
| Chandelier Exit (22,3) | 6.47 | ⚪ | Right at price |
| Aroon (25) | Up 8 / Down 96 | 🔴 | Down dominant after the Oct 22 low |
| Correlation vs $USD (20) | 0.52 | + | Direct, rising sharply |
| ADX (14) | 10.02 (+DI 33.38 / −DI 44.36) | ⚪ | No trend: −DI above +DI, but without strength |
| Keltner Channels (20,2,10) | 6.38 / 6.55 / 6.71 | lower half | Above the lower band |
| EMA (20) | 6.55 | Above price | −1.30% |
| VWAP | n/a | — | Spot, no volume |
| Stochastic (14,3,3) | 19.00 / 24.00 | 🟠 | Oversold, %K below %D |
| OBV | n/a | — | Spot, no volume |
| Williams %R (14) | −68.76 | ⚪ | Back up from oversold |
Analytical Commentary
Quantitative frame. Copper’s Compass records a moderately bearish operating regime with split coherence and reliability suspended, while the underlying trend remains a solid, persistent bull. It’s the snapshot of a correction in a bull market, with no readable trend in the short term. The four technical layers concur: copper has no direction.
Candlestick. On Friday copper gaps up at the open (6.477 against the prior close of 6.363) and closes at 6.465, within a very narrow trading range (6.463-6.477). The October 22 low, around 6.36, remains the bottom of the October cycle; the next session leaves it behind with a jump. It’s a bounce, but one born at the open, not built during the session.
Moving Averages. Price above the SMA200 (6.19, +4.44%) and below the SMA50 (6.57, −1.60%), which has stopped rising and flattened out. Since August the chart shows a wide range between 6.28 and 6.82, and copper swings between those bounds without breaking out on either side. The SMA200 keeps rising, so the backdrop stays bullish.
Ichimoku Kinko Hyo. Price dropped below the Kumo on October 22 and climbed back in on Friday. Tenkan (6.52) and Kijun (6.59) sit above price, and the projected cloud is thin and flat (Span A and Span B both at 6.56): Ichimoku’s portrait of indecision. The SAR stays above (6.76), the Chandelier coincides with price (6.47).
Bands & Levels. Back above the lower Bollinger (6.41) and the lower Keltner (6.38) after the plunge on the 22nd. Price sits between the S1 pivot (6.28) and the central pivot (6.56); the first hurdle is the 6.55-6.59 cluster, where the Bollinger midline, the EMA20, the SMA50 and the Kijun overlap.
Oscillators & Flows. The ADX at 10.02 is the decisive number: no trend. −DI (44.36) above +DI (33.38) and Aroon Down at 96 record October’s downward push, but without directional strength. MACD just below zero, RSI 44.76 neutral, Stochastic 19/24 oversold. Flows aren’t available on spot. The correlation with the dollar has risen to 0.52, an unusual link that points to copper moving in step with the dollar; whether shared flows are behind it is still unproven.
🏛️ Pretore signature for the week:
- Mon:
active short→ Fri:active long— Δ flip - Operational stop, Friday close (pipeline futures series): 6.4063
🧭 Asset Compass ($COPPER) · Friday close, October 23, 2026
  VERDICT           CONTESTED        — recent momentum neutral
  OPERATING REGIME  Moderate bear
  LINEARITY         Non-linear trends
  COHERENCE         split
  RELIABILITY       SUSPENDED
  POSITION          -- below trend   — below the underlying trend
  UNDERLYING TREND  Persistent bull  — solid
Quantitative reading of the asset’s regime: the box is based on the futures series; the price shown here is spot. The trend can’t be read with confidence. The signal is scattered, and the Compass says wait, don’t bet on where it goes. Recent momentum is neutral and price sits below the underlying trend, which remains bullish and solid: the Compass captures a tactical correction inside an underlying bull, not the end of a cycle. The short- and medium-term readings aren’t aligned, so this is an unconsolidated phase. The four layers confirm the absence of direction.
Detected Patterns
| Pattern | Status |
|---|---|
| Sideways range 6.28-6.82 since August | ✅ Confirmed |
| October 23 gap up from the cycle low | ✅ Confirmed |
| October high below September’s | ⚠️ Forming |
📌 Operating Scenario
| Item | Description |
|---|---|
| Primary scenario | Swings within the sideways range, with a test of the 6.55-6.59 cluster |
| Conditions | 6.41 (lower Bollinger) and 6.4063 (Pretore invalidation, futures) hold |
| Key support | 6.41 (lower Bollinger) → 6.38 (lower Keltner) / 6.36 area (Oct 22 low) → 6.28 (S1) → 6.19 (SMA200) |
| Key resistance | 6.52 (Tenkan) → 6.55-6.59 (EMA20, Bollinger midline, SMA50, Kijun) → 6.76 (SAR) / 6.83 (R1) |
| Warning level | Close below 6.28: exit from the sideways range toward the SMA200 |
| Estimated timing | 1-3 weeks |
BIAS: NEUTRAL — No trend (ADX 10), inside a sideways range against a bullish backdrop. Above 6.59 the correction is over; below 6.28 the range breaks.
🎯 FINBEAR Verdict
Direction: ⚪ Sideways, waiting for a direction
| Scenario | Trigger | Target | Note |
|---|---|---|---|
| ▶▶▶ CENTRAL THESIS — Sideways | 6.41 holds | Test of 6.55-6.59 | ADX 10, no trend |
| ▶▶ ALTERNATIVE SCENARIO — Bullish recovery | Close above 6.59 (Kijun) and 6.57 (SMA50) | 6.76-6.83 (SAR / R1) | Solid bullish underlying trend |
| ▶ TAIL SCENARIO — Break of the sideways range | Close below 6.28 (S1) | 6.19 (SMA200) | Only if the ADX confirms strength |
📡 Operating levels, decision dashboard and summary verdict for this asset → CTM Signal™
📎 This week “Dr. Copper” kept his diagnosis to himself: he has been pacing a sideways range for three months, below his tactical average and above his long one, with an ADX of 10 confirming there’s no trend at all. The chart doesn’t say whether global industry is slowing down or just catching its breath, nor why the metal is moving in tandem with the dollar. Chinese demand, inventories and trade policy are a matter for the RADAR Pro Elite. When the industrial barometer goes quiet, the silence is information in itself.
📈 Technical Charts — $COPPER
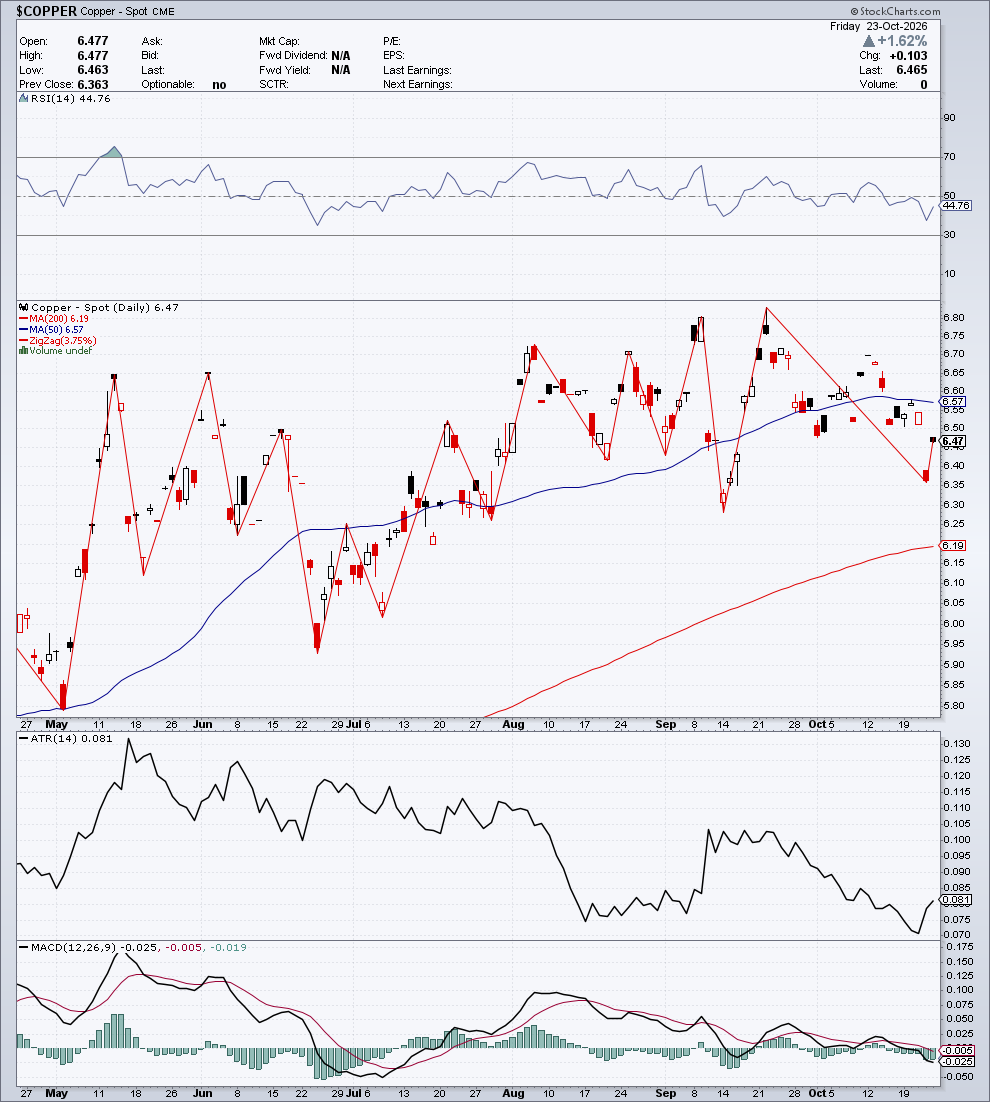
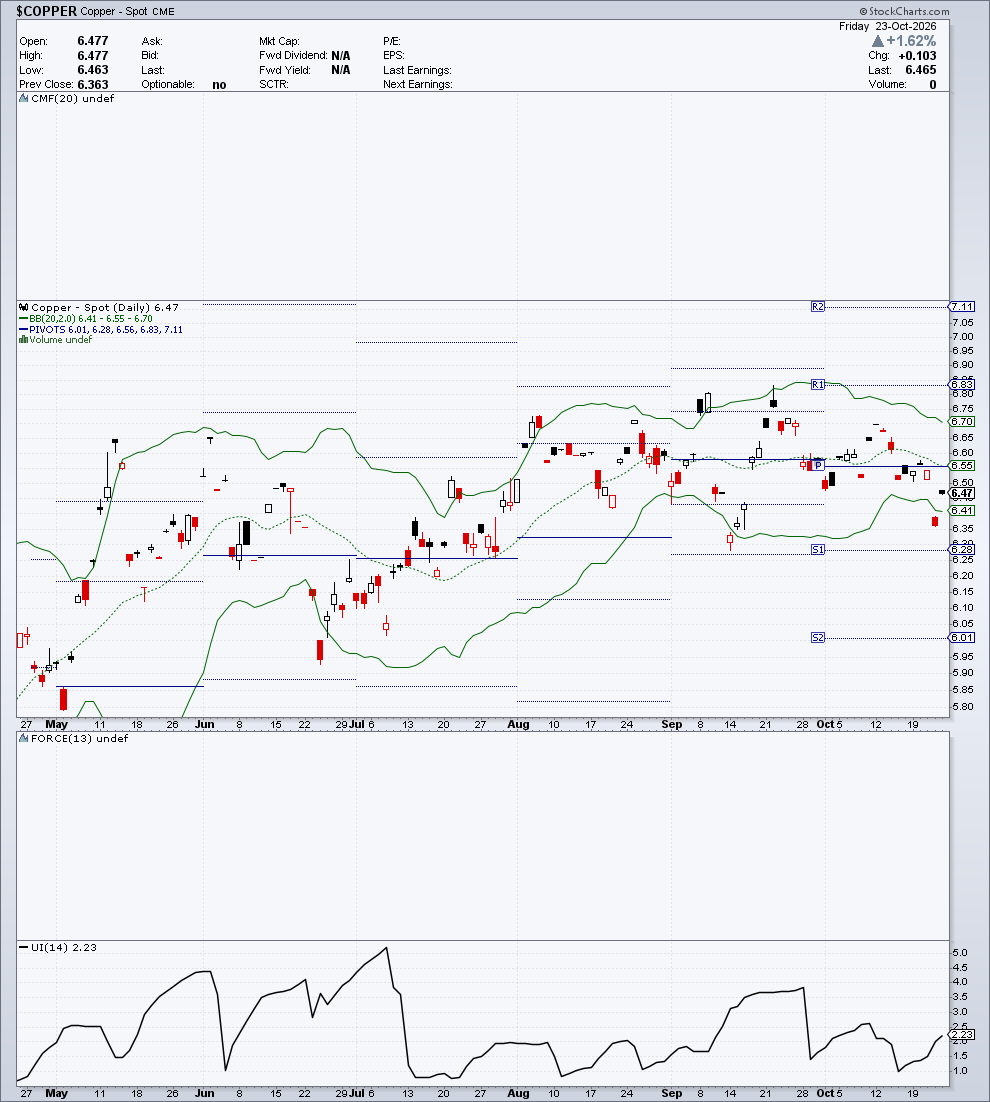
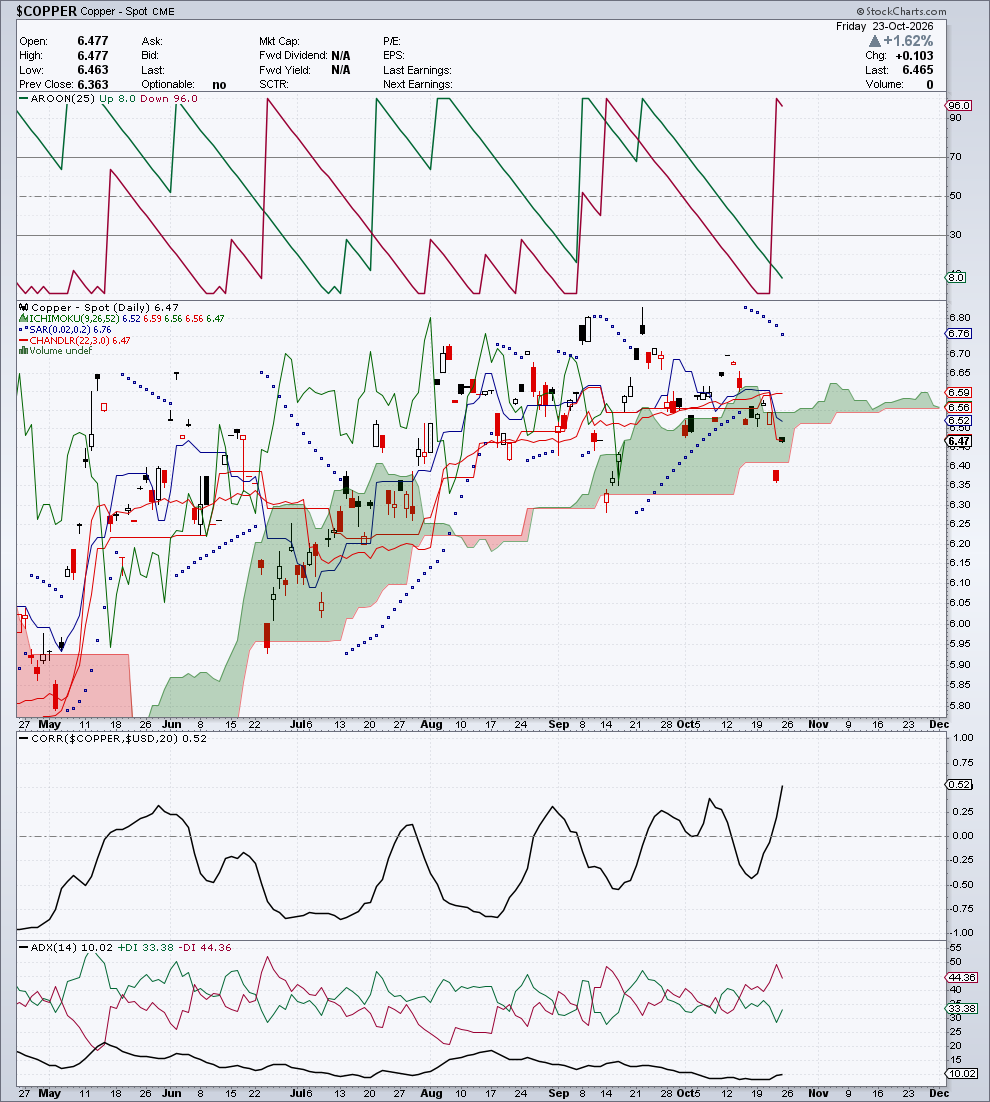
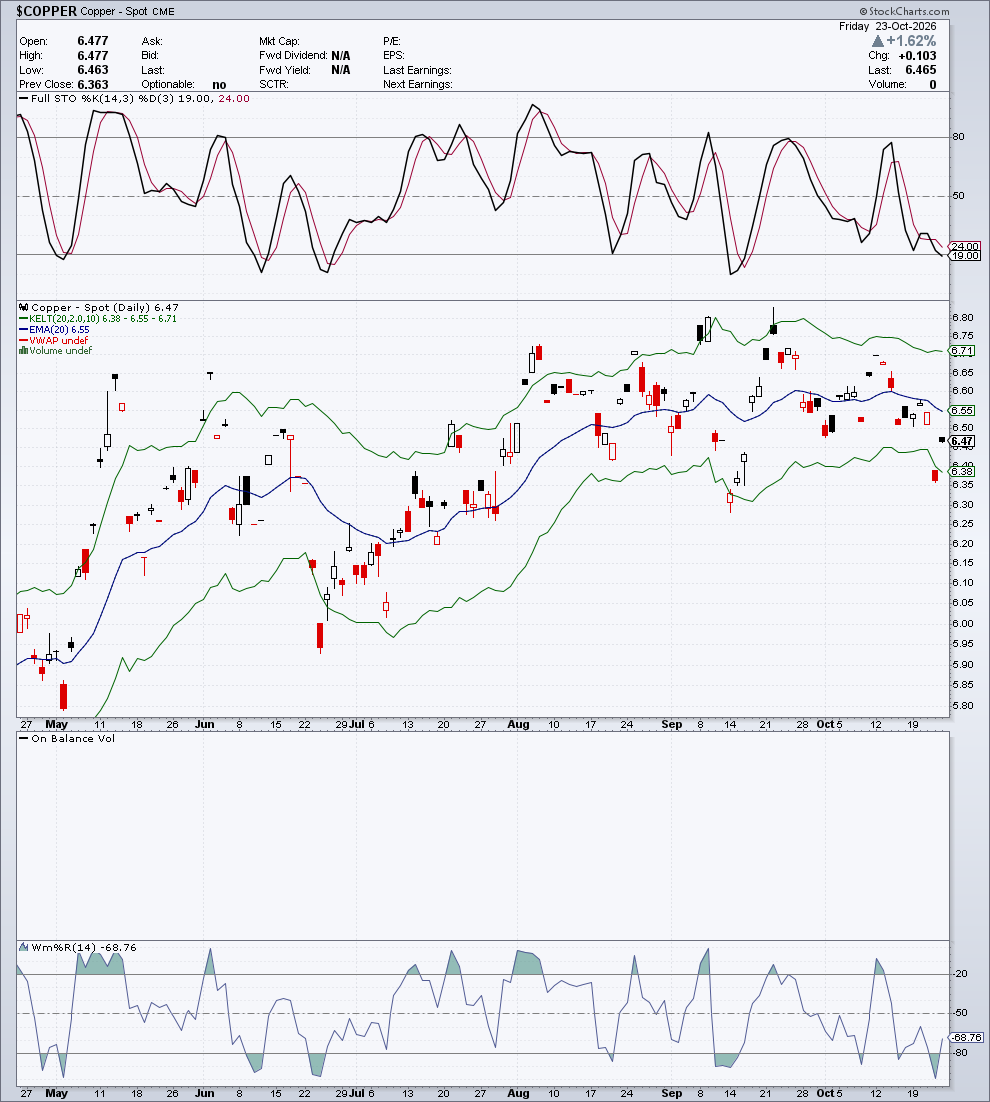
Section produced for Module C — FINBEAR™ Strategic Report — October 24, 2026
📊 Spot WTI Crude ($WTIC) — 103.45
Date: Friday, October 23, 2026 | Change: +3.98 (+4.00%) | Volume: n/a (spot)
Daily range: 98.84 – 103.92 | Prev. Close: 99.47
Indicator Table
| Indicator | Value | Signal | Notes |
|---|---|---|---|
| Trend | Bullish | 🟢 | Price > SMA50 > SMA200; higher lows since early October |
| SMA 200 | 85.12 | Below price | +21.53% |
| SMA 50 | 92.55 | Below price | +11.78% |
| Zig Zag (5.00%) | low ~87 (early Oct) → 103.45 | — | Climbing back toward the September high (~106-107) |
| RSI (14) | 65.87 | 🟢 | Strong, below the overbought threshold |
| MACD (12,26,9) | 2.259 / 1.469 | 🟢 | Histogram +0.790, line above the signal line and widening |
| ATR (14) | 4.315 | → | Stable |
| Bollinger (20,2) | 85.73 / 94.28 / 102.84 | above upper band | Close outside the upper band |
| Pivot Points | S2 73.81 · S1 82.12 · P 94.43 · R1 102.74 · R2 115.05 | above R1 | R1 cleared on the close |
| Volume by Price | n/a | — | Spot, no volume |
| CMF (20) | n/a | — | Spot, no volume |
| Force Index (13) | n/a | — | Spot, no volume |
| Ulcer Index (14) | 1.76 | low | Minimal drawdown |
| Ichimoku Full | 97.81 / 95.39 / 96.60 / 93.18 | 🟢 | Price above a green Kumo; Tenkan above Kijun |
| Parabolic SAR | 94.10 | 🟢 | Below price |
| Chandelier Exit (22,3) | 90.97 | exit | Below price, at −12.1% |
| Aroon (25) | Up 100 / Down 48 | 🟢 | New 25-session high |
| Correlation vs $USD (20) | −0.15 | ≈0 | Oil is moving on its own |
| ADX (14) | 30.32 (+DI 28.17 / −DI 7.58) | 🟢 | Confirmed trend, gaining strength |
| Keltner Channels (20,2,10) | 87.43 / 96.06 / 104.69 | upper part | Below the upper band |
| EMA (20) | 96.06 | Below price | +7.69% |
| VWAP | n/a | — | Spot, no volume |
| Stochastic (14,3,3) | 83.17 / 77.07 | 🟠 | Overbought, %K above %D |
| OBV | n/a | — | Spot, no volume |
| Williams %R (14) | −2.76 | 🟠 | Close at the 14-session high |
Analytical Commentary
Quantitative frame. WTI’s Compass records a strong, coherent and reliable bull, with momentum running at an abnormal speed; the very latest momentum is neutral, and price stays inside the band of the underlying trend, a solid, persistent bull. Across the four technical layers, Friday’s session is the acceleration the quantitative frame had already hinted at.
Candlestick. A full white candle: open at 99.10, close at 103.45 right up against the high (103.92), body at 86% of the range. The day’s +4% takes WTI decisively above 100 after a week swinging between 96 and 101 — a session of strength built during trading, not a jump at the open.
Moving Averages. A complete bullish structure: price above the SMA50 (92.55) and the SMA200 (85.12), both sloping up, with the EMA20 at 96.06. The chart shows the path: June’s collapse below 70, the summer recovery and, since early October, a series of higher lows that has carried price back toward the September high, around 106-107.
Ichimoku Kinko Hyo. Price above a green Kumo (Span A 96.60, Span B 93.18), Tenkan (97.81) above Kijun (95.39), SAR below price (94.10). The picture is bullish in every component; the projected cloud stays green and rising.
Bands & Levels. A close above the upper Bollinger (102.84) and above the R1 pivot (102.74), but still inside the Keltner (upper band at 104.69). Above price, the chart hurdle is the September high in the 106-107 area; the R2 pivot sits much higher, at 115.05. Below, the first cushion is R1 itself, then the 98.75-97.81 area.
Oscillators & Flows. The ADX is rising, at 30.32, with +DI at 28.17 against a −DI that has collapsed to 7.58. Directional strength is building decisively. Aroon Up is at 100, the MACD is positive and widening, the RSI is at 65.87. Stochastic (83/77) and Williams %R (−2.76) are overbought: price is stretched in the short term, but in a trend with the ADX above 30, overbought rides along with the thrust. Flows aren’t available on spot.
🏛️ Pretore signature for the week:
- Mon:
active long→ Fri:active long— Δ unchanged - Operational stop, Friday close (pipeline futures series): 102.635
🧭 Asset Compass ($WTIC) · Friday close, October 23, 2026
  VERDICT           CONTESTED        — recent momentum neutral
  OPERATING REGIME  STRONG BULL      [vertical rally]
  LINEARITY         Ordinary trends
  COHERENCE         FULL
  RELIABILITY       HIGH
  POSITION          in band          — above the underlying trend
  UNDERLYING TREND  Persistent bull  — solid
Quantitative reading of the asset’s regime: the box is based on the futures series; the price shown here is spot. A coherent bullish operating regime across the short and medium term, with momentum running at an abnormal speed, inside a solid, persistent underlying trend. The very latest momentum is neutral, so the regime is still waiting for confirmation. Price sits inside the band of the underlying trend: the slope is exceptional, the distance isn’t.
Detected Patterns
| Pattern | Status |
|---|---|
| Higher lows since early October | ✅ Confirmed |
| Strong bullish candle above 100 and beyond the upper Bollinger | ✅ Confirmed |
| Test of the September high (106-107 area) | ⚠️ Forming |
| Overbought on Stochastic and Williams %R | ✅ Confirmed |
📌 Operating Scenario
| Item | Description |
|---|---|
| Primary scenario | Continuation toward the September high in the 106-107 area |
| Conditions | 102.74 (R1) holds on a closing basis |
| Key support | 102.74 (R1) / 102.635 (Pretore invalidation, futures) → 98.75 / 97.81 (Tenkan) → 96.06 (EMA20) → 94.10 (SAR) |
| Key resistance | 103.92 (Friday’s high) → 104.69 (upper Keltner) → 106-107 area (September high) → 115.05 (R2) |
| Warning level | Futures close below 102.635: the bullish signature is invalidated; below 98.75 price falls back into the 96-101 congestion |
| Estimated timing | 1-2 weeks |
BIAS: BULLISH — A confirmed trend, gaining strength. Above 102.74 the CENTRAL THESIS stays intact; overbought makes a pause likely, not a reversal.
🎯 FINBEAR Verdict
Direction: 🟢 Bull, accelerating
| Scenario | Trigger | Target | Note |
|---|---|---|---|
| ▶▶▶ CENTRAL THESIS — Continuation | 102.74 (R1) holds | 106-107 area (September high) | ADX 30 and rising |
| ▶▶ ALTERNATIVE SCENARIO — Pause and pullback | Close below 102.74 | 98.75-96.06 (support / EMA20) | Short-term overbought |
| ▶ TAIL SCENARIO — Reversal | Close below 94.10 (SAR) | 90.97 (Chandelier) | Requires a break of the Kumo |
📡 Operating levels, decision dashboard and summary verdict for this asset → CTM Signal™
📎 WTI closed above 100 on a full-bodied candle with the ADX climbing: the chart records a market buying without blinking. It doesn’t say why, or what a barrel above 100 could cost the economy. Supply, geopolitical tension and central banks forced to look at energy before they look at cuts are a matter for the RADAR Pro Elite. The technical report stops at one fact: anyone who sold oil this week was fighting the tape.
📈 Technical Charts — $WTIC
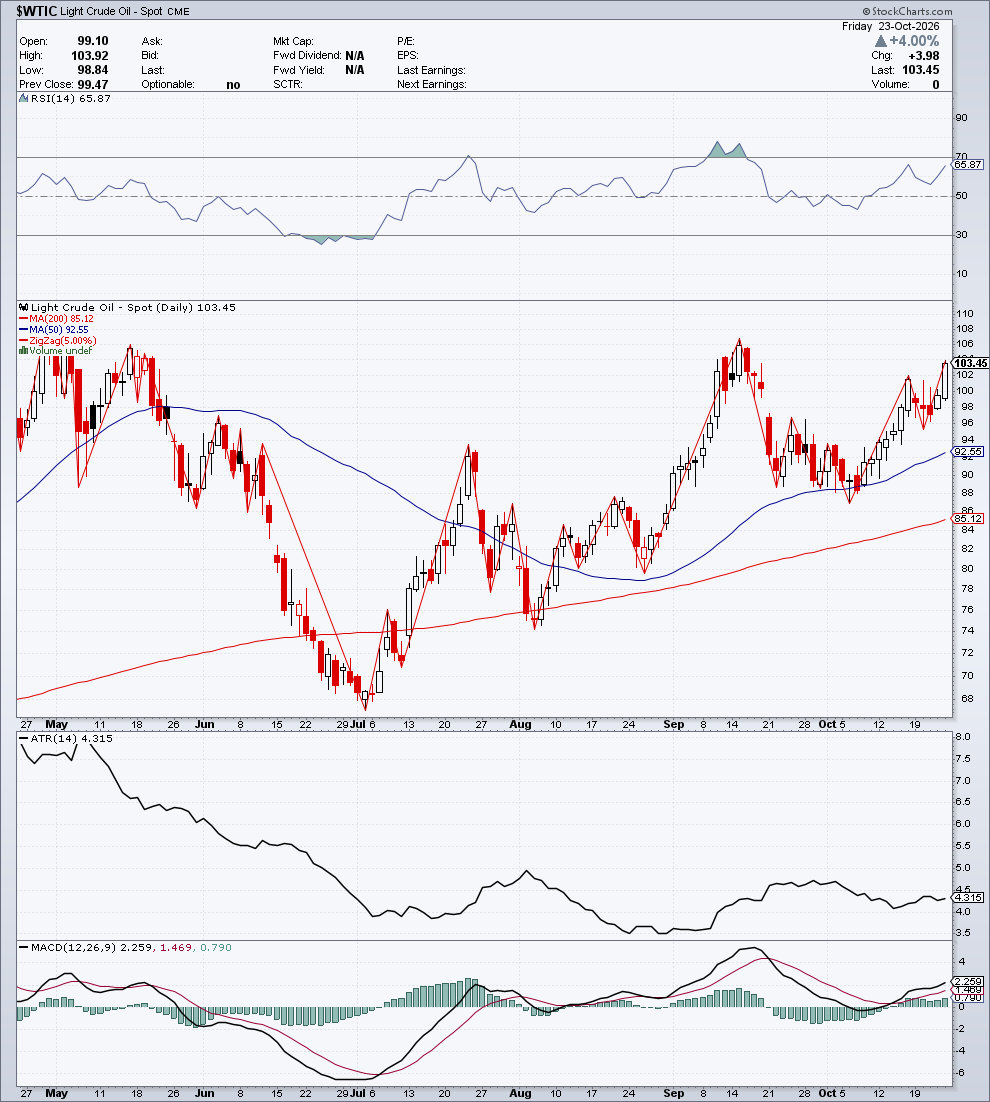
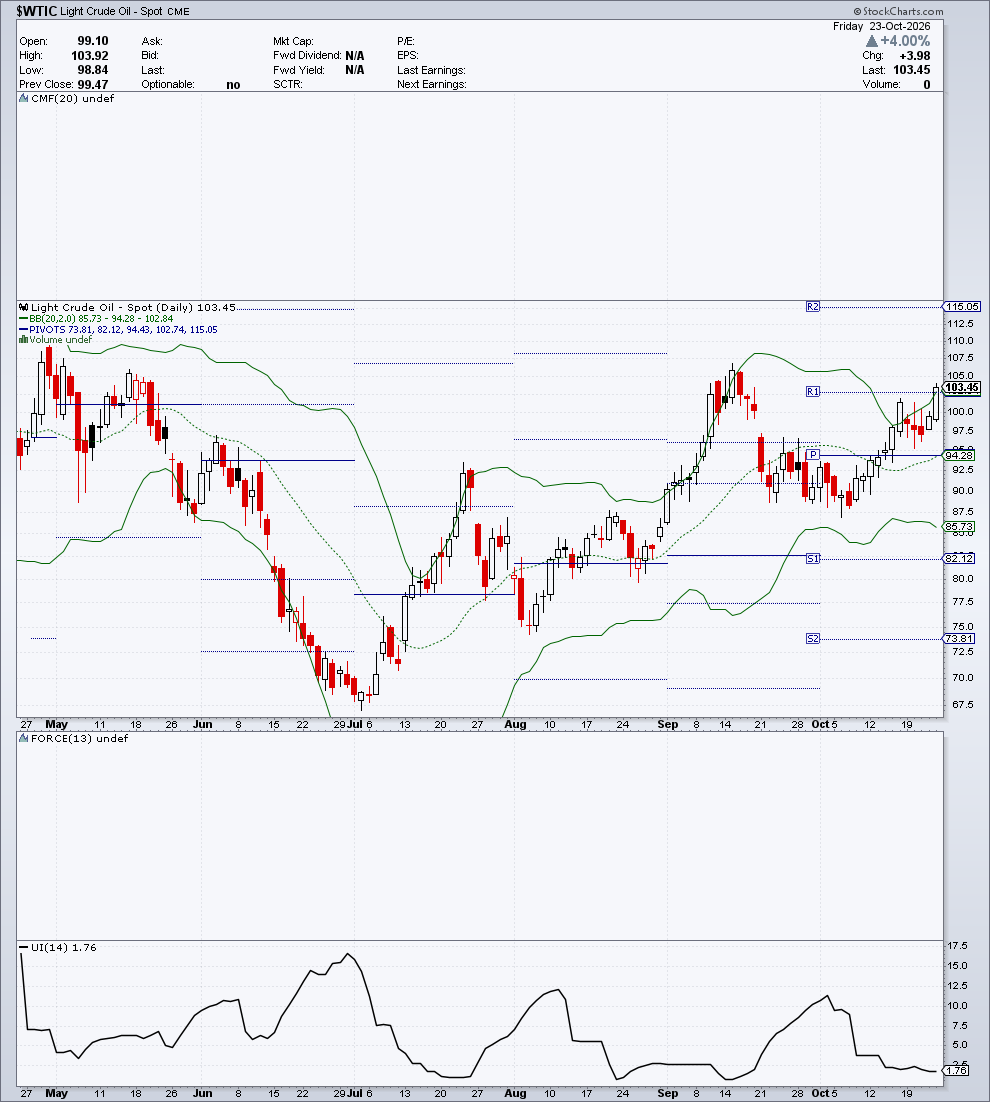
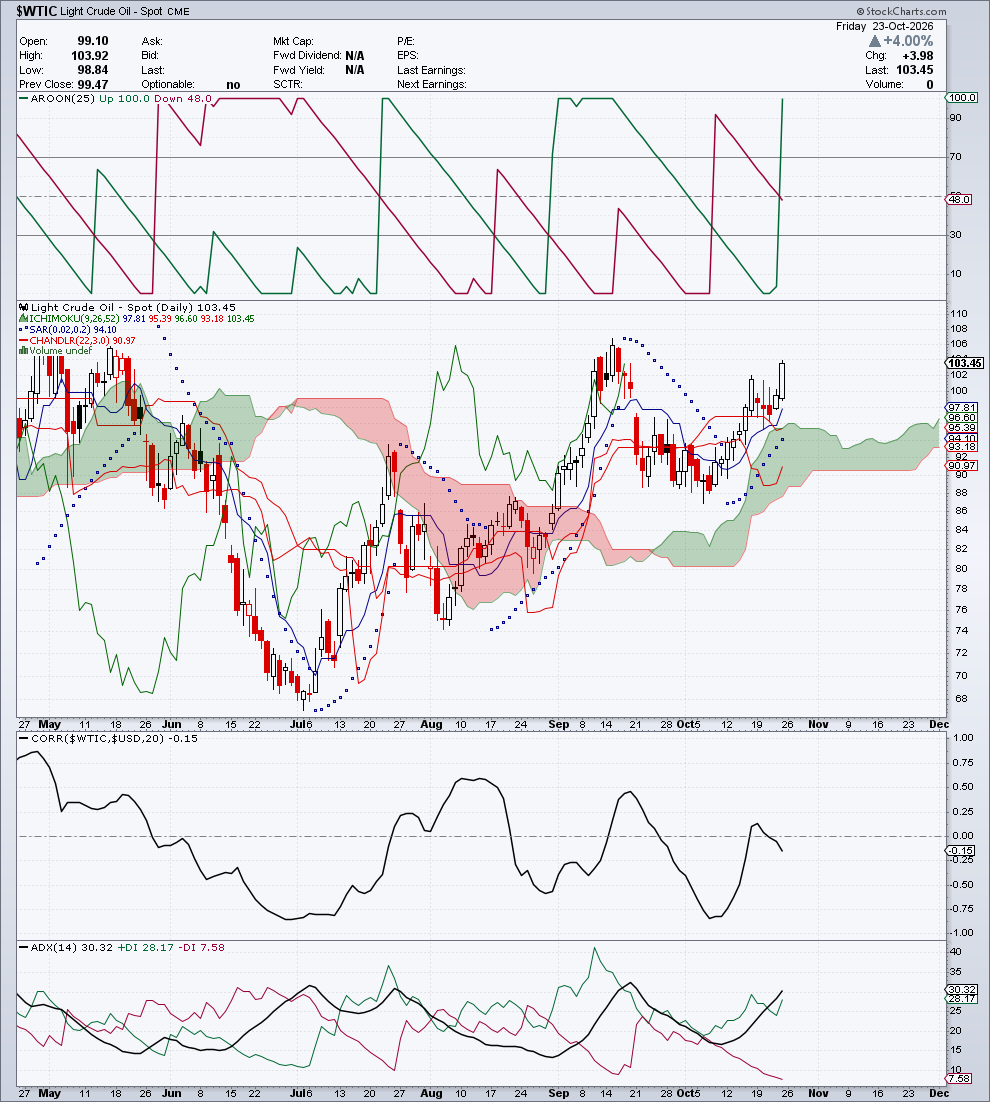
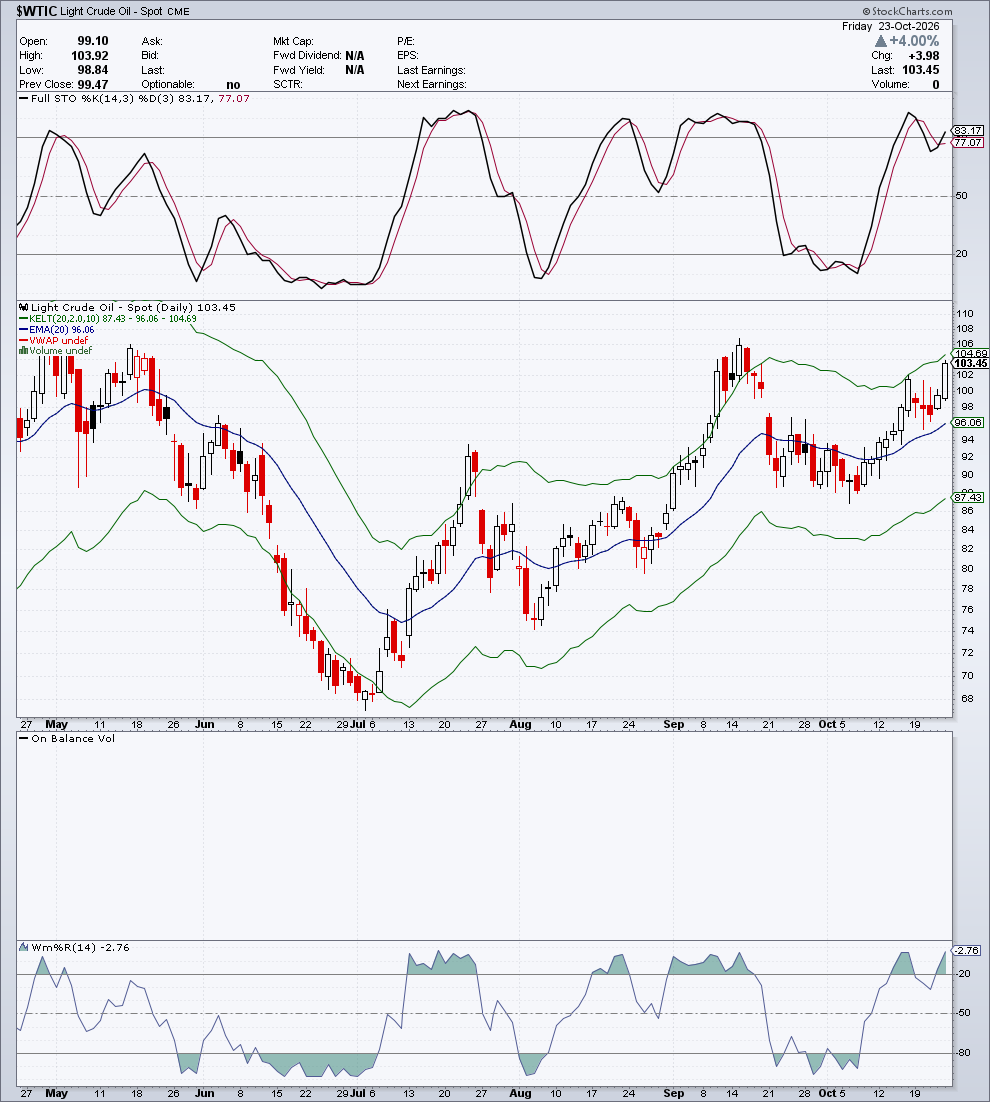
Section produced for Module C — FINBEAR™ Strategic Report — October 24, 2026
📊 Spot Brent Crude ($BRENT) — 116.90
Date: Friday, October 23, 2026 | Change: +3.73 (+3.30%) | Volume: n/a (spot)
Daily range: 115.07 – 117.41 | Prev. Close: 113.17
Indicator Table
| Indicator | Value | Signal | Notes |
|---|---|---|---|
| Trend | Bullish | 🟢 | Price > SMA50 > SMA200; new high for the period |
| SMA 200 | 90.92 | Below price | +28.57% |
| SMA 50 | 100.55 | Below price | +16.26% |
| Zig Zag (5.00%) | low ~96 (late Sep) → 116.90 | — | Beyond the September (~109) and May (~112) highs |
| RSI (14) | 72.20 | 🟠 | Overbought |
| MACD (12,26,9) | 3.476 / 2.630 | 🟢 | Histogram +0.846, widening |
| ATR (14) | 3.631 | ↑ | Edging up |
| Bollinger (20,2) | 95.36 / 105.28 / 115.20 | above upper band | Price glued to the upper band |
| Pivot Points | S2 82.24 · S1 90.14 · P 99.79 · R1 107.69 · R2 117.34 | between R1 and R2 | Session high touching R2 |
| Volume by Price | n/a | — | Spot, no volume |
| CMF (20) | n/a | — | Spot, no volume |
| Force Index (13) | n/a | — | Spot, no volume |
| Ulcer Index (14) | 0.51 | minimal | No drawdown: price is at the highs |
| Ichimoku Full | 110.87 / 106.48 / 108.67 / 101.64 | 🟢 | Price well above the Kumo; Tenkan above Kijun |
| Parabolic SAR | 100.46 | 🟢 | Below price |
| Chandelier Exit (22,3) | 106.41 | exit | Below price, at −9.0% |
| Aroon (25) | Up 100 / Down 28 | 🟢 | 25-session highs |
| Correlation vs $USD (20) | −0.03 | ≈0 | No link with the dollar |
| ADX (14) | 20.99 (+DI 38.74 / −DI 16.98) | 🟢 | Trend forming, +DI rising sharply |
| Keltner Channels (20,2,10) | 99.62 / 106.83 / 114.03 | above upper band | Double exit from the channels, to the upside |
| EMA (20) | 106.83 | Below price | +9.43% |
| VWAP | n/a | — | Spot, no volume |
| Stochastic (14,3,3) | 93.62 / 90.16 | 🟠 | Overbought |
| OBV | n/a | — | Spot, no volume |
| Williams %R (14) | −2.59 | 🟠 | Close at the 14-session high |
Analytical Commentary
Quantitative frame. Brent’s Compass captures the cleanest regime in PART III: verdict confirmed, a strong bull with linear trends, full coherence, high reliability, and a solid, persistent underlying trend. Momentum is running at an abnormal speed, but price stays inside the band of the underlying trend. The four technical layers tell the same story, with one caveat for the short term: price is stretched.
Candlestick. A gap up at the open (115.08 against the prior close of 113.17), a high at 117.41 and a close at 116.90 — a full body at 78% of the range, with almost no shadows. The gap wasn’t filled during the session. This is the candle that takes Brent beyond the September (~109) and May (~112) highs, to the highest point on the chart.
Moving Averages. Price above the SMA50 (100.55, +16.26%) and the SMA200 (90.92, +28.57%), both rising, with the EMA20 at 106.83. The chart shows the rebound from the late-September low around 96 and a stepwise climb, with higher lows, culminating in Friday’s surge.
Ichimoku Kinko Hyo. Price far above the Kumo (Span A 108.67, Span B 101.64), Tenkan (110.87) above Kijun (106.48), SAR far below price (100.46). The projected cloud is green and expanding: the Ichimoku picture is bullish in every component.
Bands & Levels. A close above the upper Bollinger (115.20) and above the upper Keltner (114.03). Price stays glued to the upper bands, the classic mark of a strong trend in progress. The session high touched the R2 pivot (117.34), the only reference above price. Below, the first foothold is the open gap between 113.17 and 115.07, then the Pretore’s invalidation level at 112.18.
Oscillators & Flows. RSI 72.20, Stochastic 93.62/90.16, Williams %R −2.59: every short-term oscillator is overbought. The ADX, though, is only at 20.99, rising, with +DI at 38.74 and −DI at 16.98. The direction is clear, and the trend’s strength is forming right now. Read that combination carefully: price already outside the bands, a trend only just being confirmed. Flows aren’t available on spot. The spread over WTI stands at $13.45, a touch below Thursday’s 13.70. WTI clawed back some ground on Friday, but international crude remains far more expensive than American crude.
🏛️ Pretore signature for the week:
- Mon:
active long→ Fri:active long— Δ unchanged - Operational stop, Friday close (pipeline futures series): 112.1767
🧭 Asset Compass ($BRENT) · Friday close, October 23, 2026
  VERDICT           CONFIRMED        — recent momentum confirms
  OPERATING REGIME  STRONG BULL      [vertical rally]
  LINEARITY         Linear trends
  COHERENCE         FULL
  RELIABILITY       HIGH
  POSITION          in band          — above the underlying trend
  UNDERLYING TREND  Persistent bull  — solid
Quantitative reading of the asset’s regime: the box is based on the futures series; the price shown here is spot. A coherent bullish operating regime across the short and medium term, with recent momentum confirming and the climb running at an abnormal speed, inside a solid, persistent underlying trend. Price stays inside the band of the underlying trend: the strain the four layers record on the short-term bands is not, for now, an excess relative to the structure.
Detected Patterns
| Pattern | Status |
|---|---|
| Break of the September and May highs | ✅ Confirmed |
| October 23 gap up, unfilled | ✅ Confirmed |
| Price glued to the upper bands (Bollinger and Keltner) | ✅ Confirmed |
| Overbought on RSI, Stochastic and Williams %R | ✅ Confirmed |
📌 Operating Scenario
| Item | Description |
|---|---|
| Primary scenario | The trend continues, consolidating above the gap |
| Conditions | 115.07 (upper edge of the gap) and 112.18 (Pretore invalidation, futures) hold on a closing basis |
| Key support | 115.07 (upper edge of the gap) → 113.17 (gap fill) → 112.18 (Pretore invalidation, futures) → 110.87 (Tenkan) → 107.69 (R1) |
| Key resistance | 117.34 (R2) / 117.41 (high) → n/a (no chart level above the period highs) |
| Warning level | A futures close below 112.18 invalidates the bullish signature; the spot gap is filled at 113.17 |
| Estimated timing | 1-2 weeks |
BIAS: BULLISH — A complete bullish structure and a trend being confirmed. Overbought makes consolidation likely; below 115.07 the ALTERNATIVE SCENARIO takes over, while 112.18, on the futures, remains the signature’s invalidation level.
🎯 FINBEAR Verdict
Direction: 🟢 Bull at the highs, stretched in the short term
| Scenario | Trigger | Target | Note |
|---|---|---|---|
| ▶▶▶ CENTRAL THESIS — Continuation with consolidation | 112.18 (futures) holds and price closes above 117.34 (R2) | n/a — no chart resistance above the highs | ADX rising, +DI dominant |
| ▶▶ ALTERNATIVE SCENARIO — Pullback from overbought | Close below 115.07 | 113.17-112.18 (gap fill / Pretore invalidation on the futures) | Every oscillator stretched |
| ▶ TAIL SCENARIO — Reversal | Close below 106.83 (EMA20) | 101.64 (Span B) / 100.55 (SMA50) | Requires the Chandelier (106.41) to give way |
📡 Operating levels, decision dashboard and summary verdict for this asset → CTM Signal™
📎 Brent ends the week at the period high, with an open gap and the oscillators running hot: the chart describes a market that buys crude first and asks the price later. A spread of more than $13 over WTI says the strain is international, not American; the why (shipping routes, supply, geopolitics) is in the RADAR Pro Elite. Price has delivered its own verdict: when oil climbs and gold falls, the bill goes to whoever burns the oil.
📈 Technical Charts — $BRENT
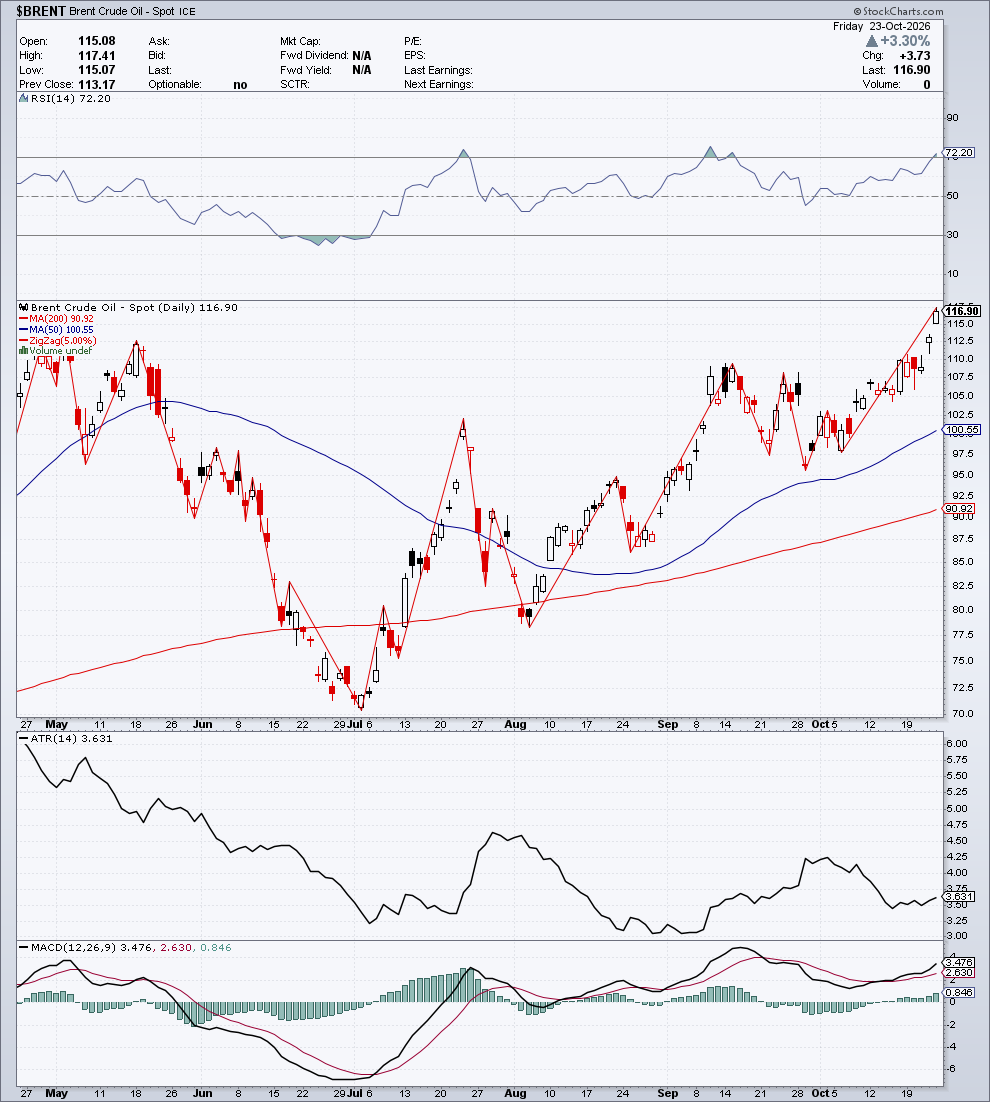
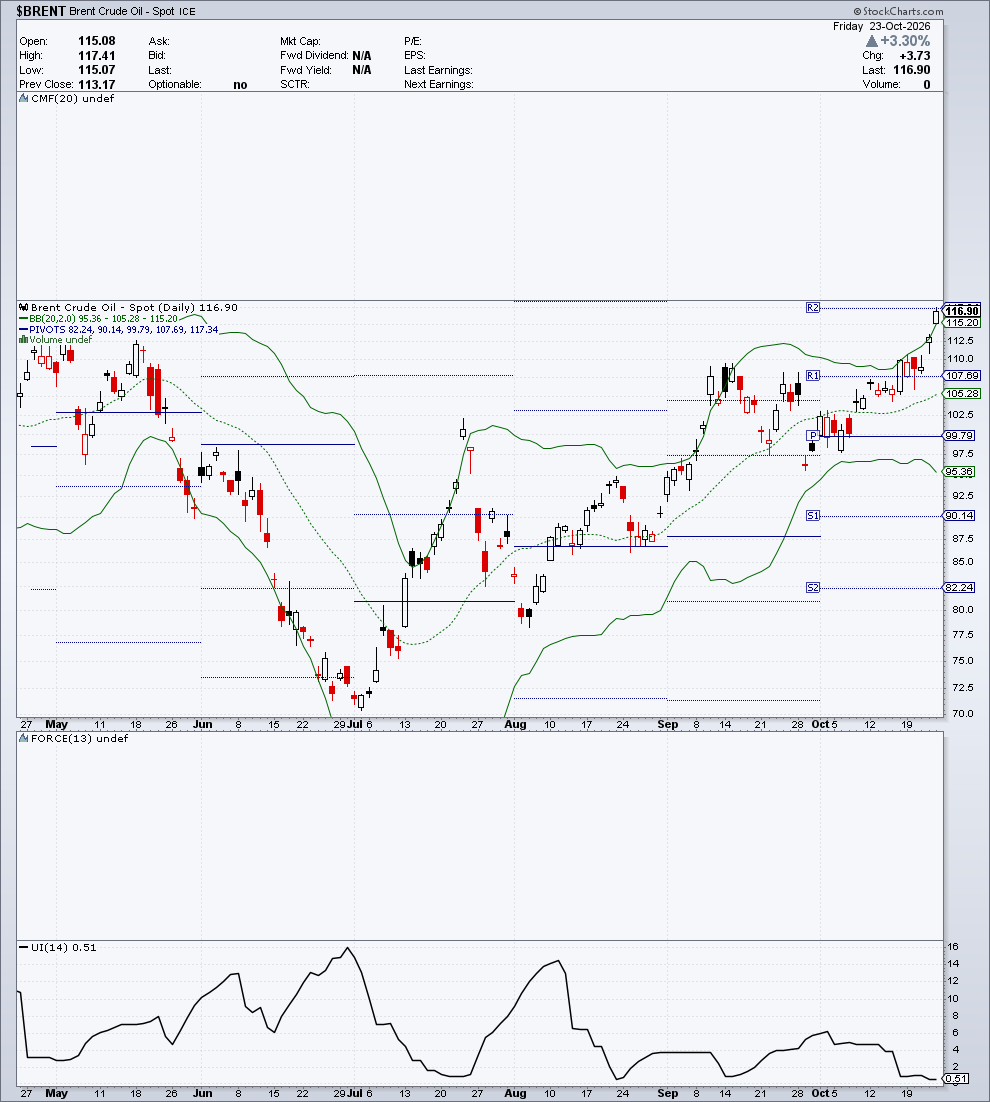
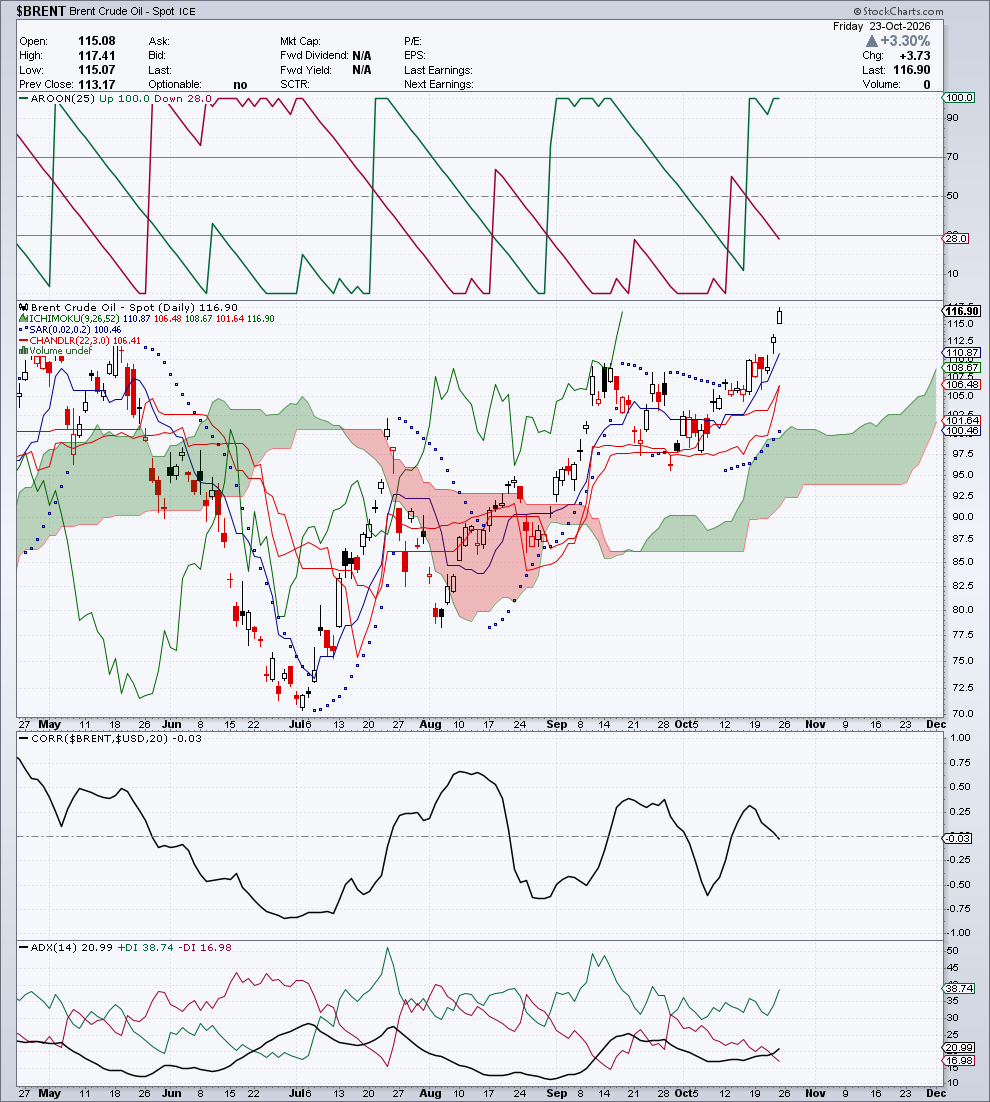
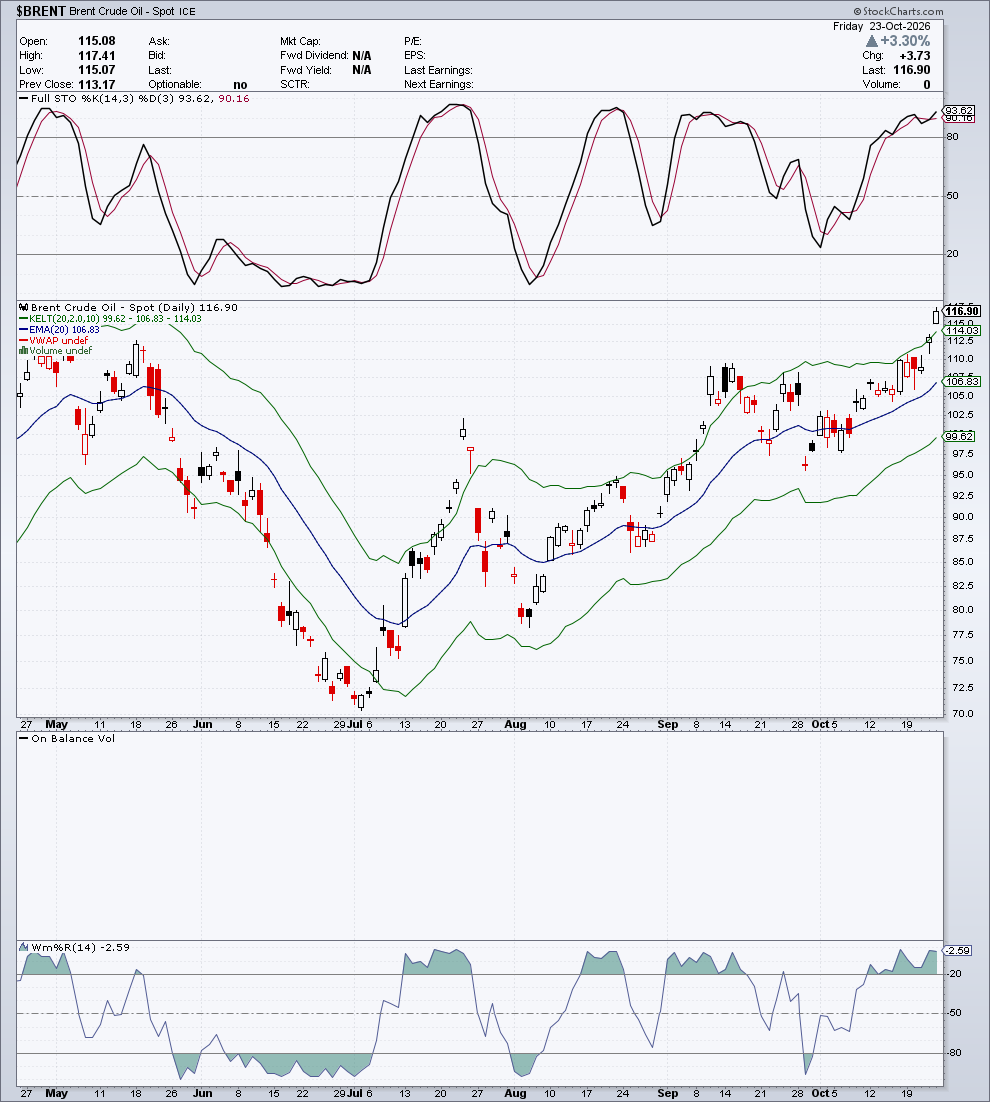
Section produced for Module C — FINBEAR™ Strategic Report — October 24, 2026
⚖️ Cross Comparison — Commodities
| Parameter | GOLD | SILVER | COPPER | WTIC | BRENT | Leader |
|---|---|---|---|---|---|---|
| Session change | −0.75% | −1.29% | +1.62% | +4.00% | +3.30% | WTIC |
| RSI(14) | 33.40 | 31.24 | 44.76 | 65.87 | 72.20 | BRENT |
| ADX (+DI/−DI) | 23.23 (10.91/29.96) | 30.04 (9.94/30.51) | 10.02 (33.38/44.36) | 30.32 (28.17/7.58) | 20.99 (38.74/16.98) | WTIC |
| Position vs Kumo | below | below | inside | above | above | WTIC / BRENT |
| CMF(20) | n/a | n/a | n/a | n/a | n/a | — |
| Gold/silver ratio | 74.14 | — | — | — | — | — |
| WTI/Brent spread | — | — | — | −$13.45 | +$13.45 | — |
| Bias | BEARISH | BEARISH | NEUTRAL | BULLISH | BULLISH | WTIC / BRENT |
Reading: Two blocs marching in opposite directions. Energy is running: $WTIC and $BRENT above the Kumo and beyond the upper Bollinger, with Brent at its period high and a spread over WTI of $13.45. Precious metals are giving way: $GOLD and $SILVER below the Kumo, with RSI between 31 and 33 and −DI dominant; the gold/silver ratio stands at 74.14 and on Friday silver fell harder than gold. $COPPER sits in the middle, in a sideways range with the lowest ADX in the panel (10.0), and the industrial barometer confirms neither a recovery nor a slowdown.
PART IV — CRYPTO & VOLATILITY
📊 Bitcoin ($BTCUSD) — 80,720.37
Date: Saturday, October 24, 2026 (morning reading, 24/7 session in progress) | Change: −401.80 (−0.50%) | Volume: 25,400
Daily range: 80,530.23 – 81,138.76 | Prev. Close: 81,122.16
Indicator Table
| Indicator | Value | Signal | Notes |
|---|---|---|---|
| Trend | Corrective within a bullish structure | ⚪ | Above the SMA200, below the SMA50 and the EMA20 |
| SMA 200 | 72,907.59 | Below price | +10.72% |
| SMA 50 | 81,813.57 | Above price | −1.34%: the tactical average has been lost |
| Zig Zag (5%) | highs ~87,000 (Sep 21 and early Oct) → ~79,800 (Oct 16) → ~84,800 (Oct 20) → 80,720 | — | Lower highs since the September peak |
| RSI (14) | 43.87 | ⚪ | Below 50, far from oversold |
| MACD (12,26,9) | −183.40 / 111.57 | 🔴 | Histogram −294.97; line below the signal line and below zero |
| ATR (14) | 2,005.81 | ↓ | Volatility falling |
| Bollinger (20,2) | 79,872.52 / 82,568.11 / 85,263.70 | lower half | Hugging the lower band |
| Pivot Points | P 81,954.16 · R1 88,952.70 · R2 94,335.45 · S1 76,571.41 · S2 69,572.87 | below pivot P | Price between S1 and P |
| Volume by Price | clusters at 82,000-86,000 and 78,000-80,000 | — | Price in the lower volume band |
| CMF (20) | −0.101 | 🔴 | Outflow |
| Force Index (13) | −40.79M | 🔴 | Selling pressure |
| Ulcer Index (14) | 2.34 | low | Contained drawdown |
| Ichimoku Full | 82,636.77 / 83,452.65 / 83,044.70 / 81,146.27 | ⚪ | Below Tenkan and Kijun, back inside the upper part of the green Kumo |
| Parabolic SAR | 80,059.93 | 🟢 | Below price, 0.8% margin |
| Chandelier Exit (22,3) | 80,803.49 | exit | Price just below the exit level (−0.10%) |
| Aroon (25) | Up 12 / Down 64 | 🔴 | Down dominant |
| Correlation vs $USD (20) | −0.09 | ≈0 | No relationship with the dollar |
| ADX (14) | 16.90 (+DI 18.53 / −DI 21.45) | ⚪ | No directional trend; −DI above +DI |
| Keltner Channels (20,2,10) | 78,362.74 / 82,272.81 / 86,182.88 | lower half | Below the channel midline |
| EMA (20) | 82,272.81 | Above price | −1.89% |
| VWAP | n/a | — | Not calculated on the chart |
| Stochastic (14,3,3) | 25.69 / 43.29 | 🔴 | %K below %D, sliding toward oversold |
| OBV | falling since the September 21 peak | 🔴 | Lower lows, no accumulation |
| Williams %R (14) | −80.90 | 🟠 | On the edge of oversold |
Analytical Commentary
The Compass captures a contested regime for $BTCUSD, with the short- and medium-term readings at odds and recent momentum leaning neither way. Inside that frame, the four layers tell the same story in more detail: an annual structure that’s still bullish, a tactical picture in correction.
Candlestick. October 24’s candle, with the session still open, is red with a small body and sits entirely inside the previous day’s range: no capitulation, no reaction. It’s the latest in a string of red candles that began after the October 20 bounce around 84,800. Buyers tried to lift their heads, and within three sessions they’d ducked back down.
Moving Averages. The SMA200 (72,907) sits far below and is still rising, so the underlying bull, born with the mid-August surge, isn’t in question. The SMA50 (81,813), however, has been lost, and the EMA20 (82,272) with it. Price now lives in the corridor between the tactical and structural averages, with lower highs since September’s 87,000 peak.
Ichimoku Kinko Hyo. Price has dropped below Tenkan (82,637) and Kijun (83,453) and slipped back into the upper part of the green Kumo. The cloud beneath is wide and still bullish, but price has stopped floating above it: it has walked into the defensive zone, and hasn’t crossed it yet.
Bands & Levels. Bollinger and Keltner show the same slide into the lower half, with the lower Bollinger band at 79,873. Price is below the central pivot (81,954) and above S1 (76,571). Volume by Price shows two dense bands: 82,000-86,000, just abandoned, and 78,000-80,000, the one it’s now resting on. The SAR (80,060) is still below price, by less than 1%, and it’s the last short-term signal still bullish; the Chandelier (80,803) has already been lost by a whisker.
Oscillators & Flows. MACD is below the signal line and below zero, Aroon Down (64) dominates Up (12), and the stochastic is falling with %K below %D. Flows confirm it: CMF at −0.101, a negative Force Index, OBV making lower lows since the September 21 peak. But the ADX at 16.9 says there’s no real downtrend: this is erosion, not a rout. The correlation with the dollar is nil (−0.09). This week bitcoin walks alone.
🏛️ Pretore signature for the week:
- Mon:
active short→ Thu 22:active short— Δ unchanged - Operational stop at the latest available snapshot (Thursday 22 bar): 82,412.2547
🧭 Asset Compass ($BTCUSD) · close, October 22, 2026
  VERDICT           CONTESTED        — recent momentum neutral
  OPERATING REGIME  Moderate bull
  LINEARITY         Ordinary trends
  COHERENCE         NONE
  RELIABILITY       HIGH
  POSITION          in band          — just above the underlying trend
  UNDERLYING TREND  Persistent bull  — unreliable
Quantitative reading of the asset’s regime: the short- and medium-term readings pull in opposite directions and recent momentum doesn’t pick a side: a contested regime, in transition, not a surrender. Position and underlying trend should be read with caution, because the structural trajectory that measures them is poorly defined.
Detected Patterns
| Pattern | Status |
|---|---|
| Lower highs since the September peak | ✅ Confirmed |
| SMA50 lost within a bullish structure | ✅ Confirmed |
| Re-entry into the Kumo from above | ✅ Confirmed |
| Test of the 78,000-80,000 volume band | ⚠️ Forming |
📌 Operating Scenario
| Item | Description |
|---|---|
| Primary scenario | Corrective sideways range between 79,600 and 81,814, with price resting on the lower volume band |
| Conditions | 79,600 (mid-October low, tested several times) and the SAR must hold; reclaiming the SMA50 would reopen the top of the range |
| Key support | 80,060 (SAR) → 79,595 (multi-touch support) → 78,069 → 76,571 (S1) |
| Key resistance | 81,814 (SMA50) → 82,412 → 84,733 → 87,161 |
| Warning level | Close below 79,600: the mid-October base breaks and the 76,000-78,000 area opens up |
| Estimated timing | 1-2 weeks |
BIAS: NEUTRAL-WEAK — Bullish annual structure, tactical picture eroding, with negative flows but no confirmed trend. Below 79,600 the ALTERNATIVE SCENARIO takes over; above 82,412 the correction is filed away.
🎯 FINBEAR Verdict
Direction: 🟡 Underlying bull in a tactical correction
| Scenario | Trigger | Target | Note |
|---|---|---|---|
| ▶▶▶ CENTRAL THESIS — Corrective sideways range | 79,600 holds without a reclaim of 81,814 | 79,600 – 81,814 band | ADX below the trend threshold, flows negative but weak |
| ▶▶ ALTERNATIVE SCENARIO — The base breaks | Close below 79,600 | 78,069 → 76,571 (S1) | MACD and OBV already pointing down |
| ▶ TAIL SCENARIO — Rally resumes | Holds above 82,412 and the SMA50 on a closing basis | 84,733 → 87,161 | Needs flows to turn positive again |
📡 Operating levels, decision dashboard and summary verdict for this asset → CTM Signal™
📎 Bitcoin’s chart says one precise thing: August’s bull is still standing, but for a month every bounce has been sold. What the chart doesn’t say is who’s selling, and why the correlation with the dollar has dropped to zero right now. Global liquidity, long-term rates and risk appetite live in the RADAR Pro Elite. Anyone who reads “above the SMA200” as “all clear” is looking at August’s photograph, not October’s.
📈 Technical Charts — $BTCUSD
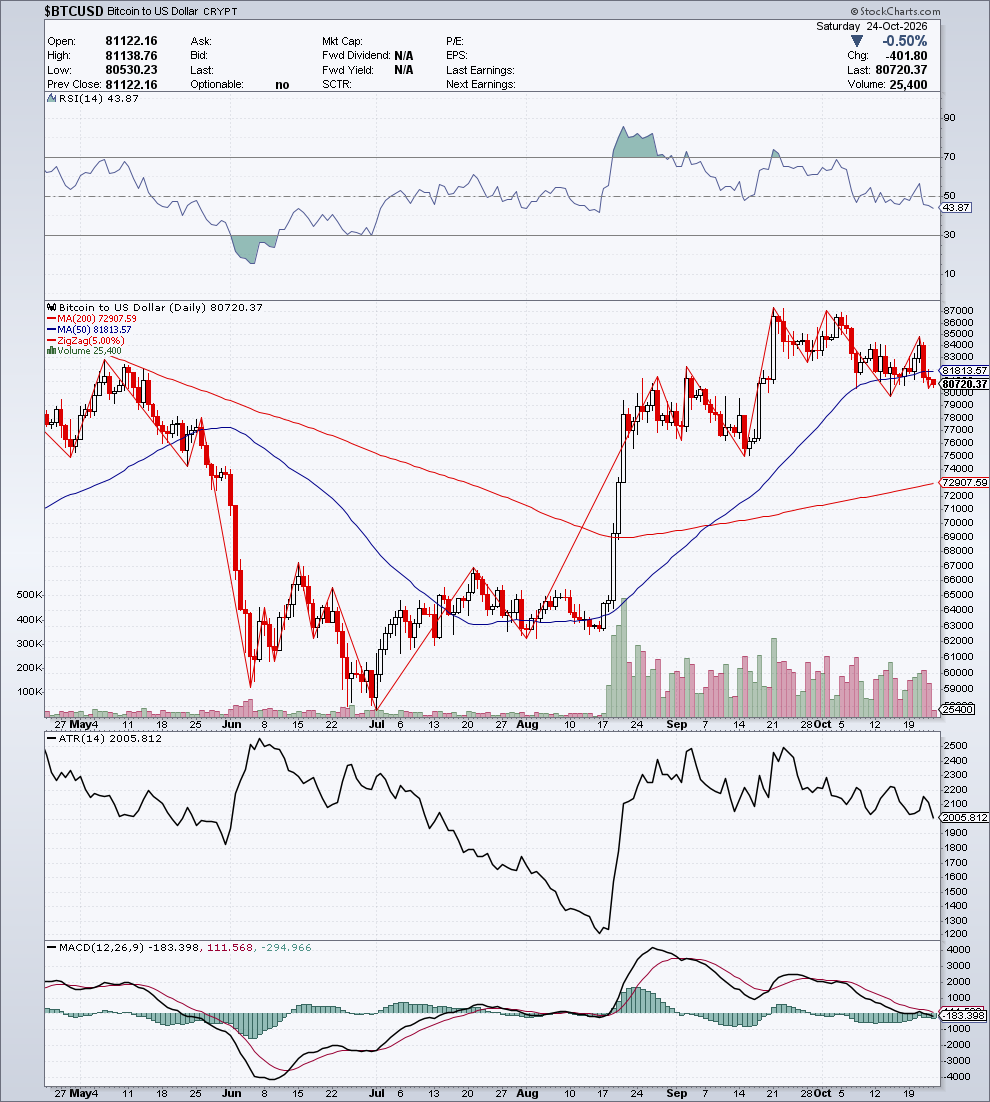
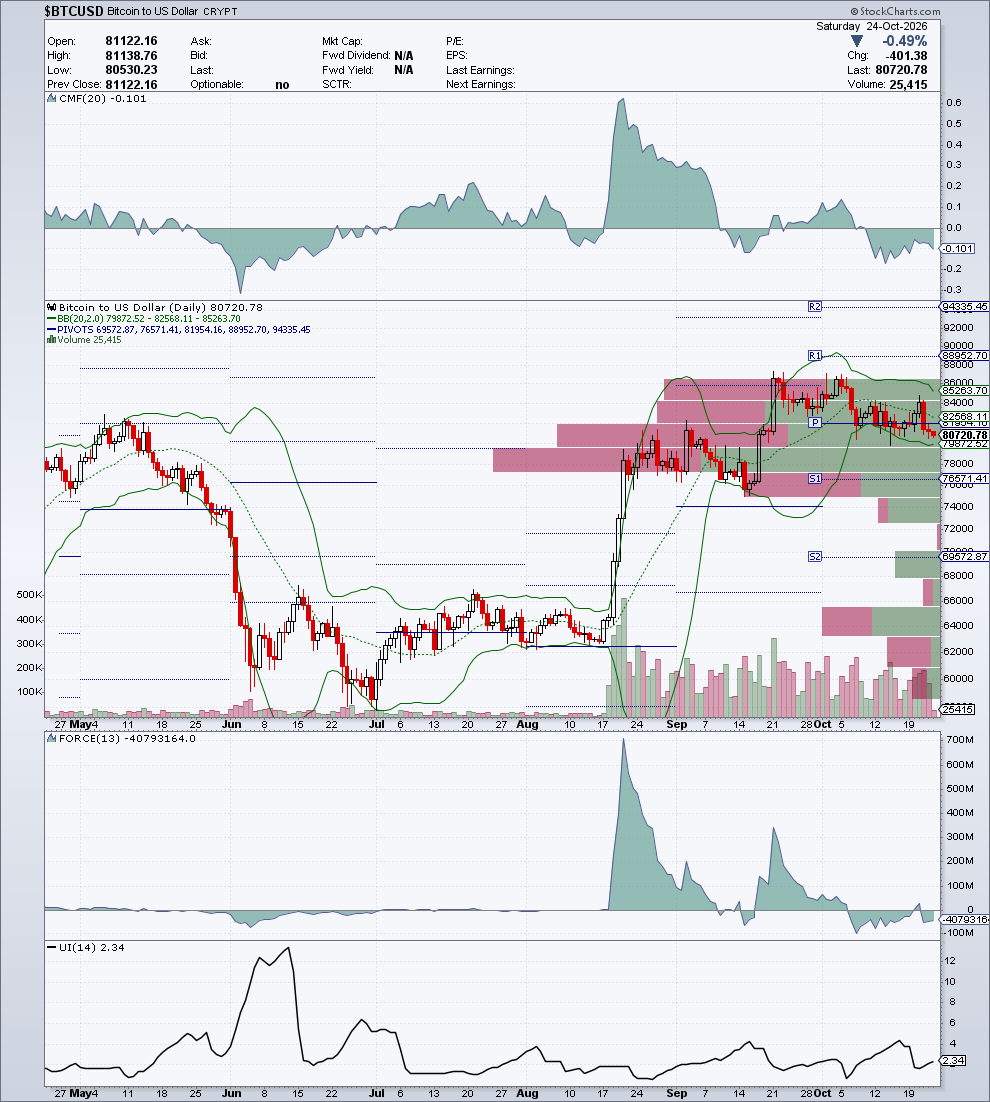
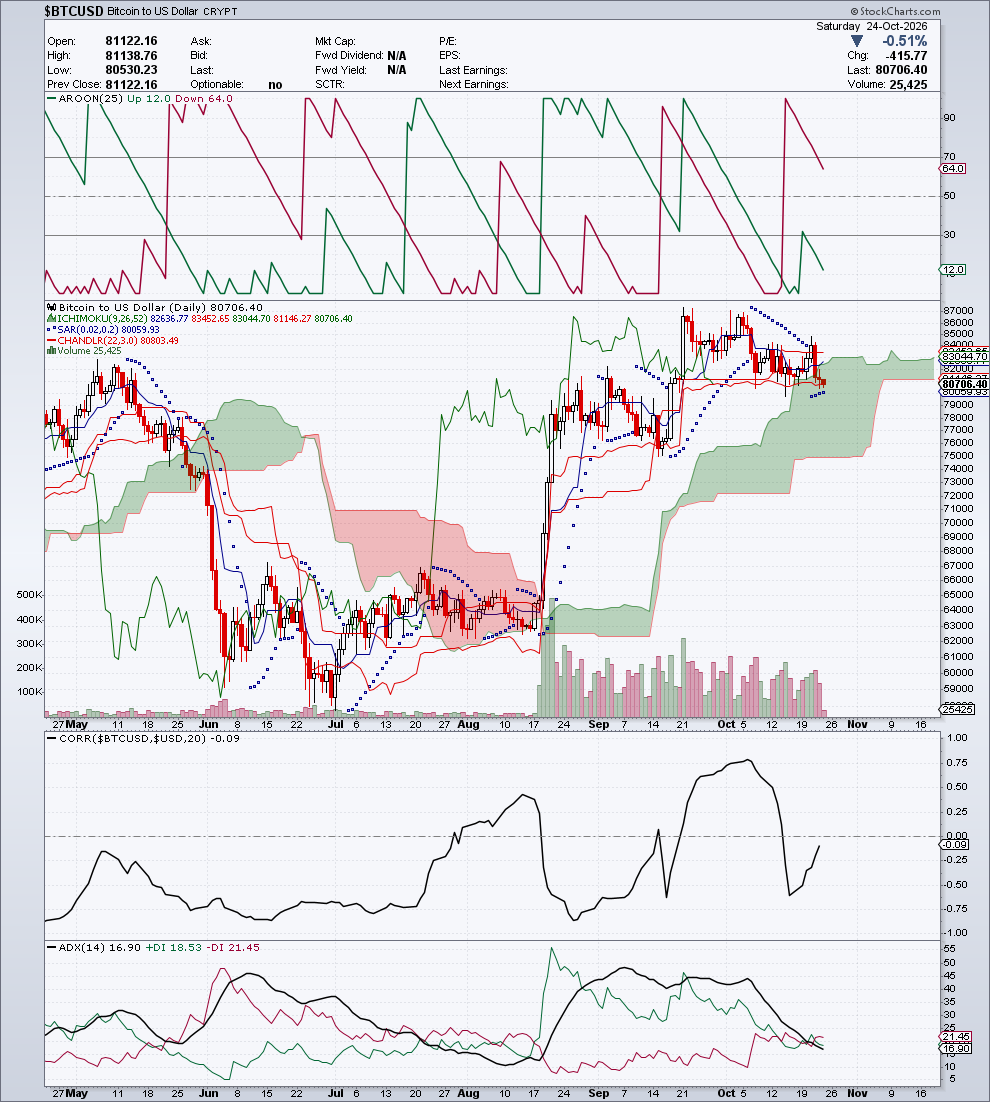
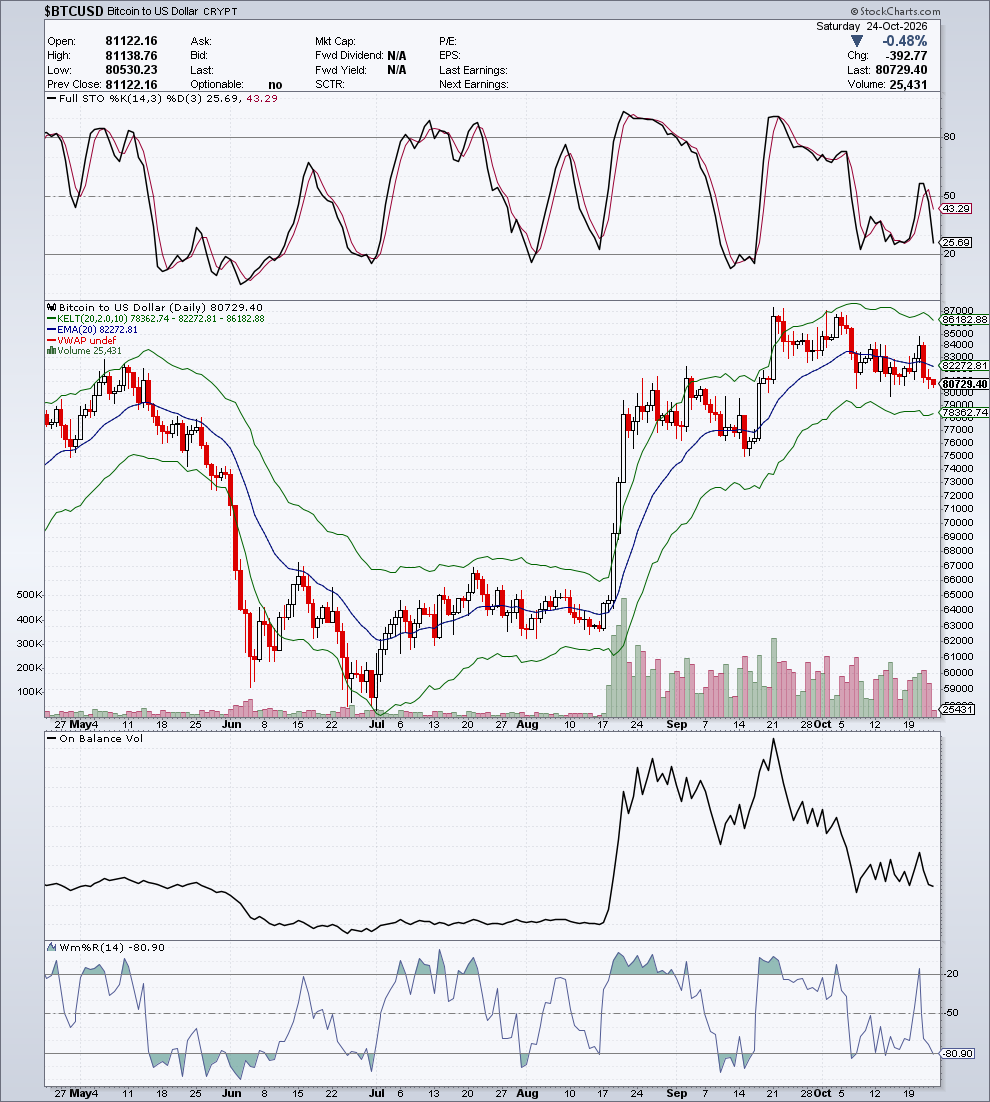
Section produced for Module C — FINBEAR™ Strategic Report — October 24, 2026
📊 Ethereum ($ETHUSD) — 2,377.20
Date: Saturday, October 24, 2026 (morning reading, 24/7 session in progress) | Change: −8.25 (−0.35%) | Volume: 224,636
Daily range: 2,367.98 – 2,387.46 | Prev. Close: 2,385.45
Indicator Table
| Indicator | Value | Signal | Notes |
|---|---|---|---|
| Trend | Short-term bearish within a bullish annual structure | 🔴 | Below the SMA50 and the EMA20, above the SMA200 |
| SMA 200 | 2,156.96 | Below price | +10.21% |
| SMA 50 | 2,547.32 | Above price | −6.68% |
| Zig Zag (5%) | high ~2,800 (Sep 21) → ~2,330 (mid-Oct) → ~2,520 (Oct 20) → 2,377 | — | Bounce rejected below the SMA50 |
| RSI (14) | 37.82 | 🟠 | Weak, above oversold |
| MACD (12,26,9) | −49.49 / −40.70 | 🔴 | Histogram −8.79; line below the signal line and below zero |
| ATR (14) | 85.76 | ↓ | Falling from the October peak |
| Bollinger (20,2) | 2,290.62 / 2,474.69 / 2,658.76 | lower half | Price between the midline and the lower band |
| Pivot Points | P 2,615.43 · R1 2,874.07 · R2 3,063.61 · S1 2,425.89 · S2 2,167.24 | below S1 | S1 lost, now resistance |
| Volume by Price | clusters at 2,400-2,500 and 2,650-2,720 | — | Price just below the densest band |
| CMF (20) | −0.132 | 🔴 | Outflow |
| Force Index (13) | −25.37M | 🔴 | Selling pressure, easing |
| Ulcer Index (14) | 4.44 | medium-high | Down from the mid-October peak |
| Ichimoku Full | 2,424.43 / 2,547.68 / 2,486.06 / 2,564.04 | 🔴 | Below Tenkan and Kijun, in the lower part of the Kumo |
| Parabolic SAR | 2,504.29 | 🔴 | Above price |
| Chandelier Exit (22,3) | 2,477.19 | exit | Price below the exit level (−4.0%) |
| Aroon (25) | Up 12 / Down 64 | 🔴 | Down dominant |
| Correlation vs $USD (20) | −0.26 | − | Weak inverse |
| ADX (14) | 27.68 (+DI 15.44 / −DI 25.27) | 🔴 | Confirmed trend, bearish direction |
| Keltner Channels (20,2,10) | 2,298.55 / 2,466.53 / 2,634.52 | lower half | Near the lower band |
| EMA (20) | 2,466.53 | Above price | −3.62% |
| VWAP | n/a | — | Not calculated on the chart |
| Stochastic (14,3,3) | 23.68 / 32.38 | 🔴 | %K below %D, near oversold |
| OBV | sideways-to-softer below the early-October peak | ⚪ | No volume capitulation |
| Williams %R (14) | −78.69 | 🟠 | Close to oversold |
Analytical Commentary
The Compass suspends judgment on $ETHUSD: the short- and medium-term readings disagree, and the medium-term signal is scattered. The four layers, on the other hand, show a clear short-term direction, and it points down; the annual structure, above the SMA200, remains bullish.
Candlestick. October 24’s candle, with the session open, has a minimal body and sits entirely inside the previous day’s range. What matters happened earlier in the week: the October 20 bounce toward 2,520 was turned back below the SMA50 in two sessions, and price has gone back to brushing the mid-month lows.
Moving Averages. The SMA50 (2,547) is now a distant ceiling (−6.7%) and has stopped rising; the EMA20 (2,467) is falling. The SMA200 (2,157) sits more than 10% below and is still climbing. It’s the geometry of a deep correction inside a bull cycle: the structural floor is far away, the tactical one has already caved in.
Ichimoku Kinko Hyo. Price is below Tenkan (2,424) and Kijun (2,548) and has sunk into the lower part of the green Kumo. The SAR (2,504) is above price and the Chandelier (2,477) has been lost. Ahead, the cloud thins out and turns red in early November: the Kumo’s support gets flimsier just as price leans on it.
Bands & Levels. Price is below pivot S1 (2,426), now turned into resistance, and is working between the Bollinger midline (2,475) and the lower band (2,291). Volume by Price puts the densest band at 2,400-2,500, which price has just broken below — that’s the weight price will have to lift to get back into balance.
Oscillators & Flows. Ethereum has the strongest downtrend of the three cryptos: ADX 27.7 with −DI (25.3) well above +DI (15.4), Aroon Down 64 against Up 12, MACD below zero. CMF (−0.132) is the heaviest outflow of the three cryptos. Stochastic and Williams are close to oversold, and OBV shows no capitulation selling: this is orderly selling, not panic.
🏛️ Pretore signature for the week:
- Mon:
active short→ Thu 22:active short— Δ unchanged - Operational stop at the latest available snapshot (Thursday 22 bar): 2,405.0015
🧭 Asset Compass ($ETHUSD) · close, October 22, 2026
  VERDICT           CONTESTED        — recent momentum neutral
  OPERATING REGIME  STRONG BEAR
  LINEARITY         Non-linear trends
  COHERENCE         NONE
  RELIABILITY       SUSPENDED
  POSITION          in band          — just above the underlying trend
  UNDERLYING TREND  Persistent bull  — unreliable
Quantitative reading of the asset’s regime: the short- and medium-term readings pull in opposite directions and the medium-term signal is scattered. The regime is contested; the Compass suspends its directional judgment and says wait, don’t bet on where it goes. Position and underlying trend should be read with caution. The underlying trend remains bullish: this is a tactical correction, not the end of the cycle.
Detected Patterns
| Pattern | Status |
|---|---|
| Bounce rejected below the SMA50 (Oct 20-22) | ✅ Confirmed |
| Pivot S1 and Chandelier lost | ✅ Confirmed |
| Test of the mid-October lows (~2,330) | ⚠️ Forming |
📌 Operating Scenario
| Item | Description |
|---|---|
| Primary scenario | A correction that goes back to testing the mid-October lows in the 2,330-2,340 area |
| Conditions | The correction only stops if 2,338 holds and 2,426 (S1) is reclaimed |
| Key support | 2,338 (multi-touch support) → 2,291 (lower Bollinger) → 2,273 → 2,157 (SMA200) |
| Key resistance | 2,405 → 2,426 (S1) → 2,475-2,477 (Bollinger midline and Chandelier) → 2,547 (SMA50) |
| Warning level | Close below 2,291: the correction targets the SMA200 area |
| Estimated timing | 1-2 weeks |
BIAS: BEARISH (tactical) — A downtrend confirmed by the ADX inside an annual structure that’s still bullish. Above 2,426 the pressure eases; below 2,291 the ALTERNATIVE SCENARIO takes over.
🎯 FINBEAR Verdict
Direction: 🔴 Trending correction above the SMA200
| Scenario | Trigger | Target | Note |
|---|---|---|---|
| ▶▶▶ CENTRAL THESIS — Test of the lows | Price below 2,426 (S1) | 2,338 → 2,291 | Bearish ADX, heaviest outflow among the cryptos |
| ▶▶ ALTERNATIVE SCENARIO — Slide toward the SMA200 | Close below 2,291 | 2,273 → 2,157 | Thin Kumo ahead, fragile support |
| ▶ TAIL SCENARIO — Recovery | Close above 2,477 (Chandelier) | 2,547 (SMA50) | Oscillators near oversold, OBV with no capitulation |
📡 Operating levels, decision dashboard and summary verdict for this asset → CTM Signal™
📎 Ethereum has the cleanest downtrend among the cryptos and, at the same time, the Compass that most plainly says “I don’t know”: price is falling in good order, while the medium-term statistics can’t find a readable trajectory. The chart doesn’t explain whether this is fatigue with the platform or plain rotation within the sector. That thread runs through the RADAR Pro Elite. An orderly sell-off isn’t a crash, but it isn’t a bargain either just because the price has come down.
📈 Technical Charts — $ETHUSD
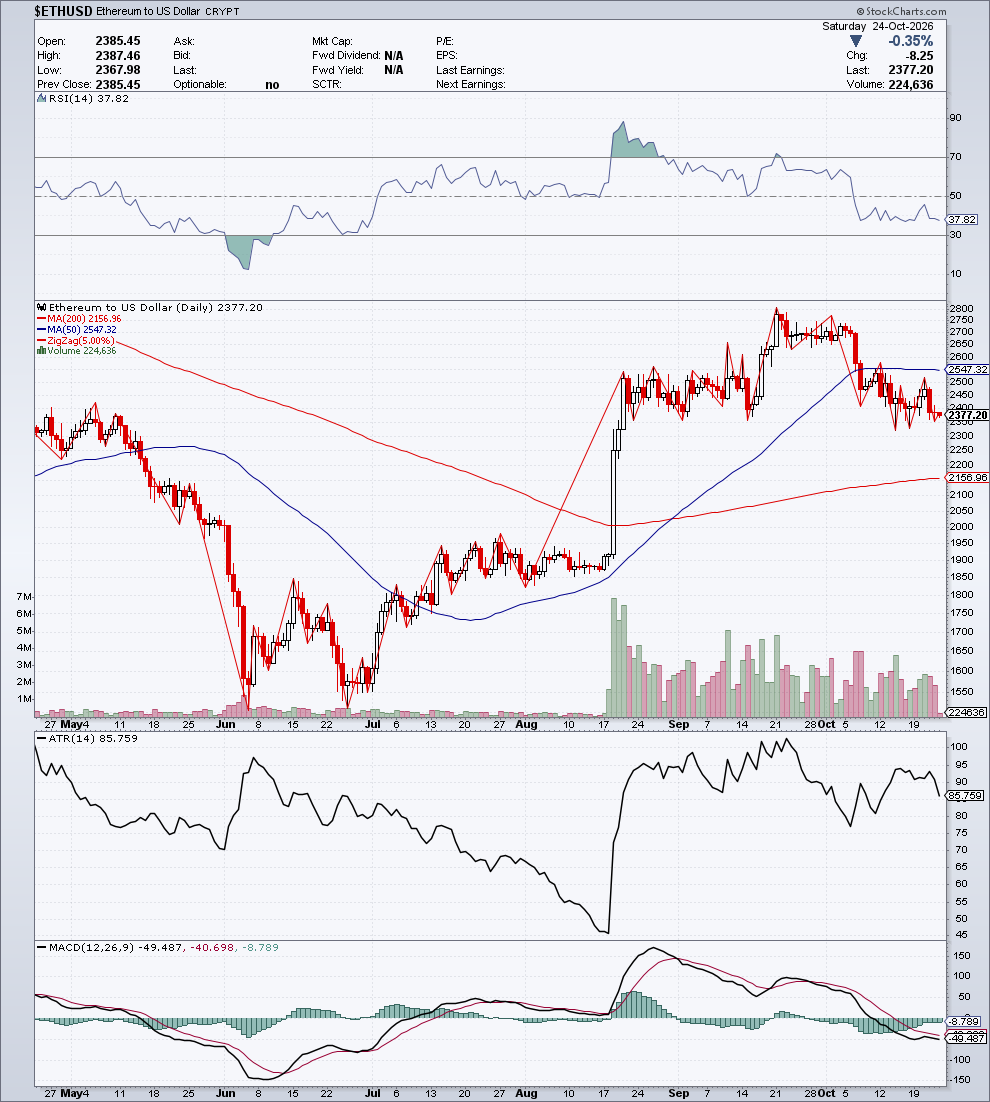
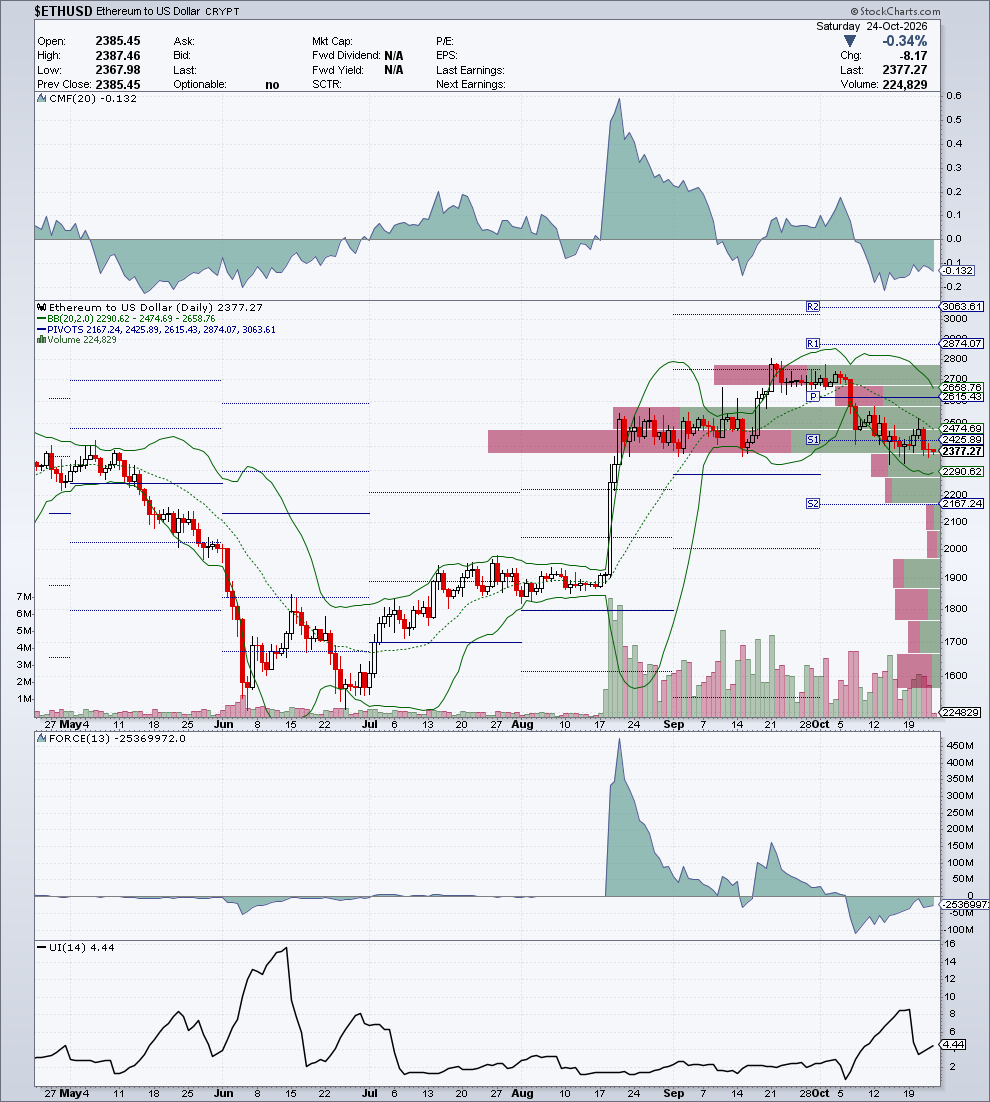
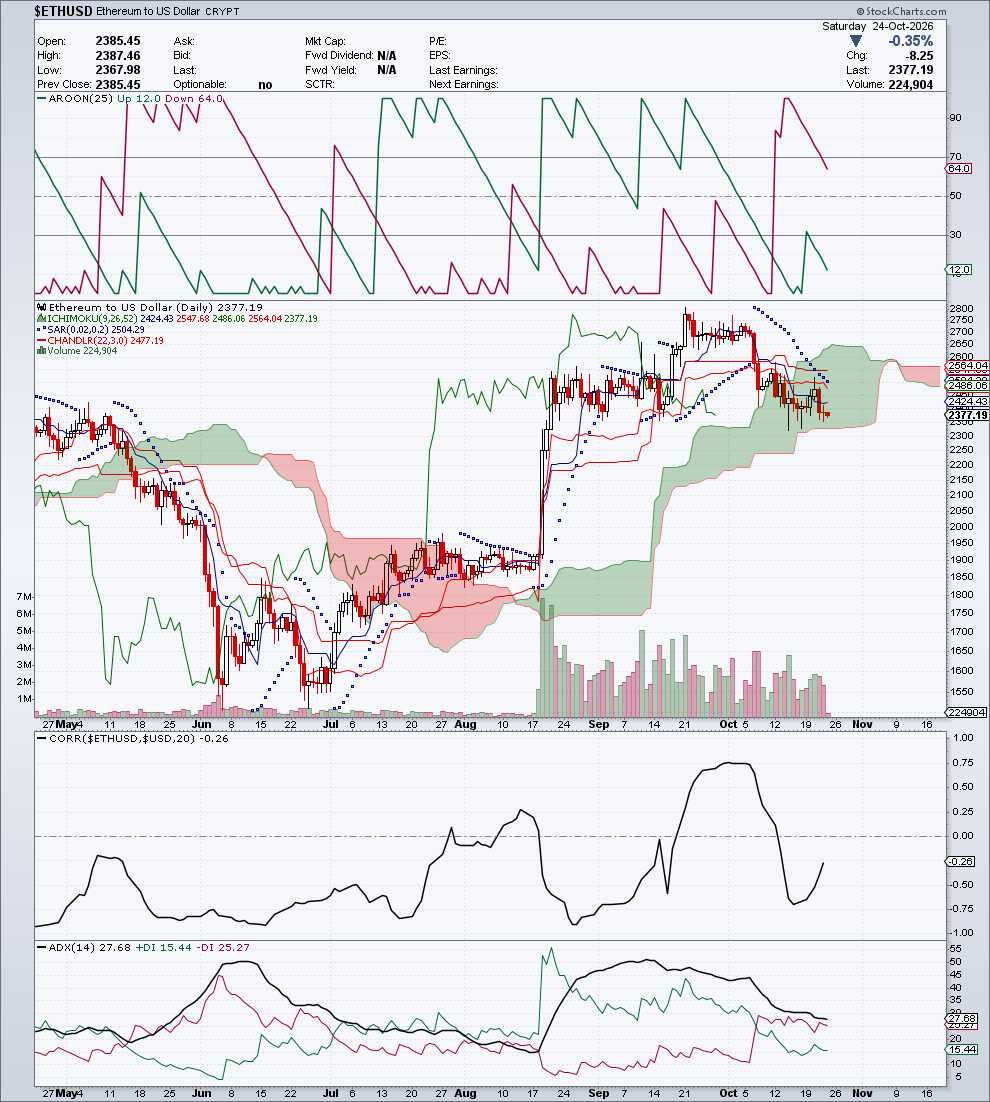
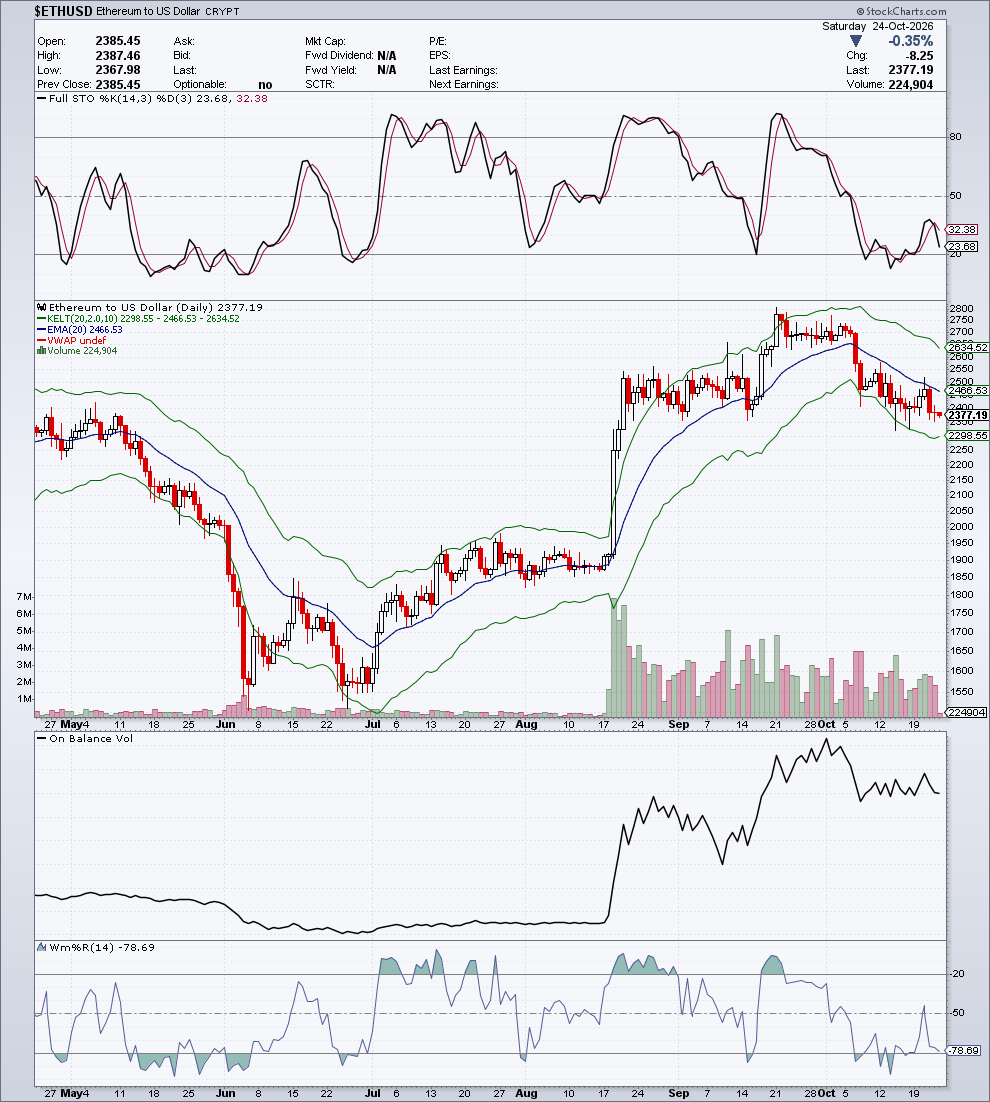
Section produced for Module C — FINBEAR™ Strategic Report — October 24, 2026
📊 Solana ($SOLUSD) — 102.12
Date: Saturday, October 24, 2026 (morning reading, 24/7 session in progress) | Change: −0.66 (−0.64%) | Volume: 2,025,585
Daily range: 101.94 – 103.01 | Prev. Close: 102.78
Indicator Table
| Indicator | Value | Signal | Notes |
|---|---|---|---|
| Trend | Short-term bearish within a bullish annual structure | 🔴 | Below the SMA50 and the EMA20, above the SMA200 |
| SMA 200 | 88.28 | Below price | +15.68% |
| SMA 50 | 109.65 | Above price | −6.87% |
| Zig Zag (5%) | high ~124 (late Sep) → ~101 (mid-Oct) → ~108 (Oct 20) → 102.12 | — | Bounce rejected below the SMA50 |
| RSI (14) | 37.25 | 🟠 | Weak, above oversold |
| MACD (12,26,9) | −2.321 / −1.680 | 🔴 | Histogram −0.641; line below the signal line and below zero |
| ATR (14) | 4.276 | ↓ | Volatility falling |
| Bollinger (20,2) | 97.11 / 107.93 / 118.76 | lower half | Price between the midline and the lower band |
| Pivot Points | P 112.90 · R1 129.97 · R2 141.91 · S1 100.97 · S2 83.90 | hugging S1 | Last pivot before S2 |
| Volume by Price | clusters at 104-106 and 117-121 | — | Price just below the densest band |
| CMF (20) | −0.119 | 🔴 | Outflow |
| Force Index (13) | −6.53M | 🔴 | Selling pressure, easing |
| Ulcer Index (14) | 5.87 | medium-high | The highest among the cryptos |
| Ichimoku Full | 104.77 / 112.03 / 108.40 / 110.33 | 🔴 | Below Tenkan and Kijun, in the lower part of the Kumo |
| Parabolic SAR | 108.66 | 🔴 | Above price |
| Chandelier Exit (22,3) | 108.94 | exit | Price below the exit level (−6.3%) |
| Aroon (25) | Up 12 / Down 76 | 🔴 | Down dominant, the highest of the group |
| Correlation vs $USD (20) | −0.24 | − | Weak inverse |
| ADX (14) | 25.23 (+DI 16.07 / −DI 24.83) | 🔴 | Trend just confirmed, bearish direction |
| Keltner Channels (20,2,10) | 98.93 / 107.08 / 115.23 | lower half | Near the lower band |
| EMA (20) | 107.08 | Above price | −4.63% |
| VWAP | n/a | — | Not calculated on the chart |
| Stochastic (14,3,3) | 18.63 / 25.74 | 🟠 | %K oversold, below %D |
| OBV | giving way after the October 20 bounce | 🔴 | Below the early-October peak |
| Williams %R (14) | −86.87 | 🟠 | Oversold |
Analytical Commentary
The Compass records a contested regime for $SOLUSD, with medium reliability and the short term leaning down. The four layers confirm the same fracture: a bullish annual structure, a confirmed tactical decline.
Candlestick. October 24’s candle, with the session open, is red with a small body, and its intraday low (101.94) brushes pivot S1. As with bitcoin and ethereum, what counts is the October 20 bounce toward 108, turned back below the SMA50 and swallowed up in three sessions.
Moving Averages. Price is 6.9% below the SMA50 (109.65), which has stopped rising; the EMA20 (107.08) is falling. The SMA200 (88.28) sits far lower (+15.7%) — this is the crypto with the widest structural cushion, and also the one that has lost the most since the late-September high.
Ichimoku Kinko Hyo. Price is below Tenkan (104.77) and Kijun (112.03) and has sunk into the lower part of the green Kumo, whose lower edge sits just under 100. SAR (108.66) and Chandelier (108.94) are both above price: the short-term exit levels were lost days ago.
Bands & Levels. Price is sitting on pivot S1 (100.97), the last foothold before S2 (83.90). The lower Bollinger band (97.11) and the lower Keltner band (98.93) mark the floor of the channel. Volume by Price shows the densest band at 104-106. Price has just dropped below it, and every return to that area runs into the people who bought there.
Oscillators & Flows. The ADX at 25.2, with −DI above +DI, has just confirmed the downtrend. Aroon Down at 76 is the highest reading among the cryptos, MACD is below zero, CMF and Force Index are negative. The Stochastic (18.6) and Williams %R (−86.9) are oversold: a sign of excess, not of reversal, as long as price stays in the lower part of the Kumo and below the SMA50.
🏛️ Pretore signature for the week:
- Mon:
active short→ Thu 22:active short— Δ unchanged - Operational stop at the latest available snapshot (Thursday 22 bar): 106.2897
🧭 Asset Compass ($SOLUSD) · close, October 22, 2026
  VERDICT           CONTESTED        — recent momentum neutral
  OPERATING REGIME  STRONG BEAR
  LINEARITY         Ordinary trends
  COHERENCE         NONE
  RELIABILITY       MEDIUM
  POSITION          in band          — just above the underlying trend
  UNDERLYING TREND  Persistent bull  — unreliable
Quantitative reading of the asset’s regime: the short- and medium-term readings pull in opposite directions, with the short term leaning down: a contested regime, in transition, not a surrender. Medium reliability and a poorly defined underlying trend call for caution when reading position and backdrop. The underlying trend remains bullish: this is a tactical correction, not the end of the cycle.
Detected Patterns
| Pattern | Status |
|---|---|
| Bounce rejected below the SMA50 (Oct 20-23) | ✅ Confirmed |
| Test of pivot S1 (~101) | ⚠️ Forming |
| Oversold on stochastic and Williams | ✅ Confirmed |
📌 Operating Scenario
| Item | Description |
|---|---|
| Primary scenario | Pressure on pivot S1 and the mid-October lows in the 100-101 area |
| Conditions | The decline only stops if 100.97 holds and 104.77 (Tenkan) is reclaimed |
| Key support | 101.51 → 100.97 (S1) → 97.94 → 97.11 (lower Bollinger) |
| Key resistance | 104.77 (Tenkan) → 106.29 → 107.08-107.93 (EMA20 and Bollinger midline) → 109.65 (SMA50) |
| Warning level | Close below 97.11: price exits the channel and the 93-95 area opens up |
| Estimated timing | 1-2 weeks |
BIAS: BEARISH (tactical) — A downtrend just confirmed, oscillators oversold, annual structure intact. Above 106.29 the pressure eases; below 97.11 the ALTERNATIVE SCENARIO takes over.
🎯 FINBEAR Verdict
Direction: 🔴 Trending correction above the SMA200
| Scenario | Trigger | Target | Note |
|---|---|---|---|
| ▶▶▶ CENTRAL THESIS — Test of S1 | Price below 104.77 | 100.97 → 97.94 | Highest Aroon Down of the group |
| ▶▶ ALTERNATIVE SCENARIO — Exit from the channel | Close below 97.11 | 95.73 → 93.32 | Pivot S2 far away (83.90) |
| ▶ TAIL SCENARIO — Oversold bounce | Close above 106.29 | 107.93 → 109.65 (SMA50) | Stochastic and Williams stretched |
📡 Operating levels, decision dashboard and summary verdict for this asset → CTM Signal™
📎 Solana is the crypto sector’s speculation thermometer, and the thermometer says the fever is breaking: since the late-September high it has lost more than bitcoin and ethereum, and oversold still isn’t enough to stop the slide. The chart doesn’t say whether speculative money is leaving the sector or just changing horses. The answer lives in the RADAR Pro Elite. Oversold can last a long time; anyone who takes it as an invitation is reading the oscillator, not the trend.
📈 Technical Charts — $SOLUSD
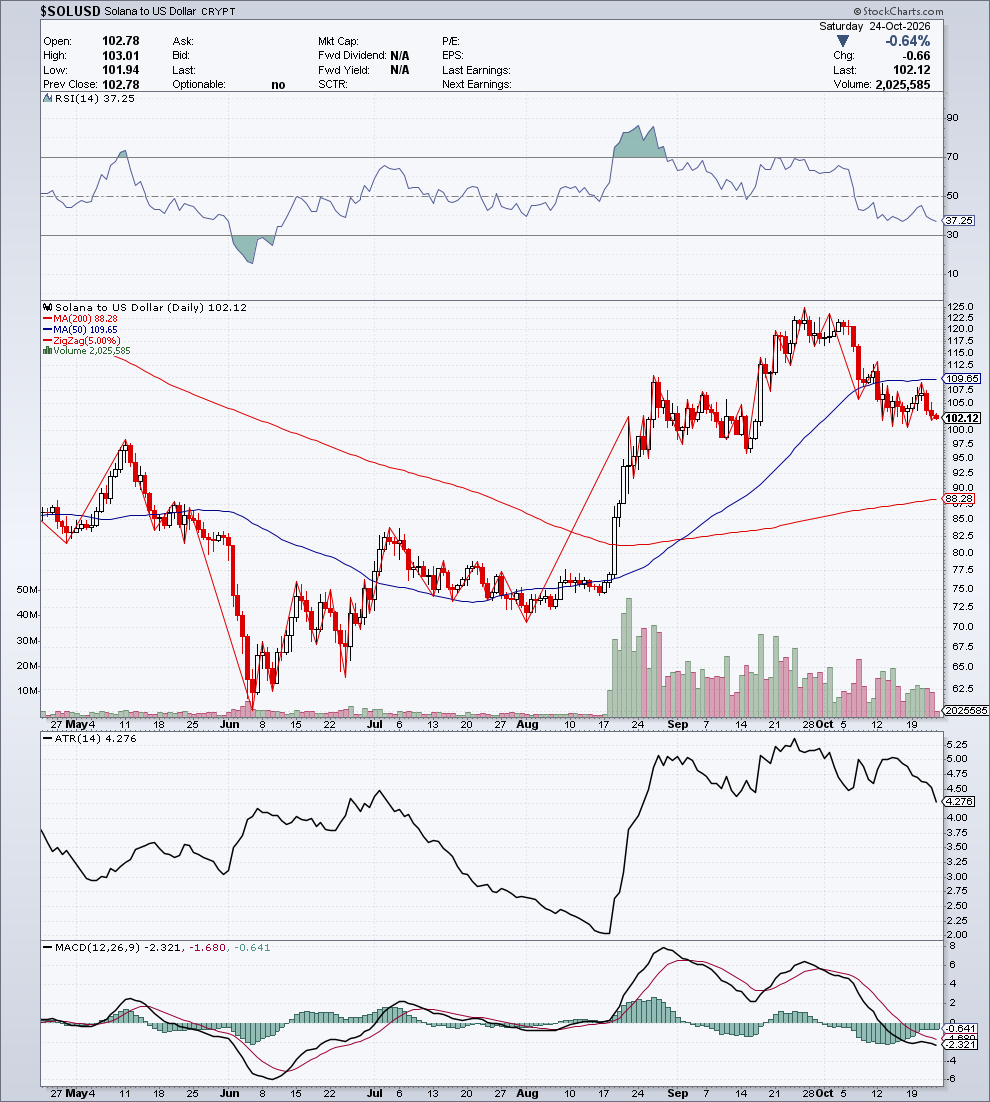
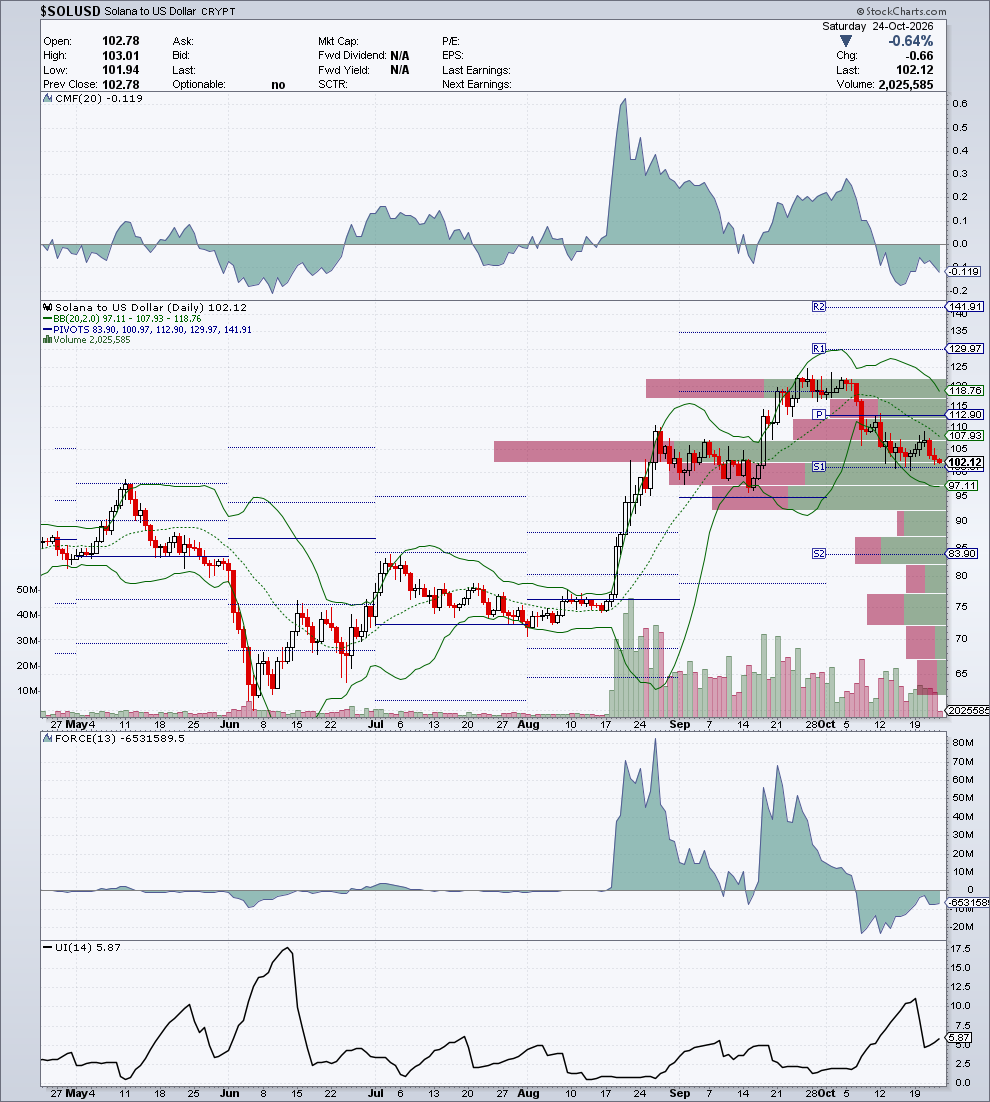
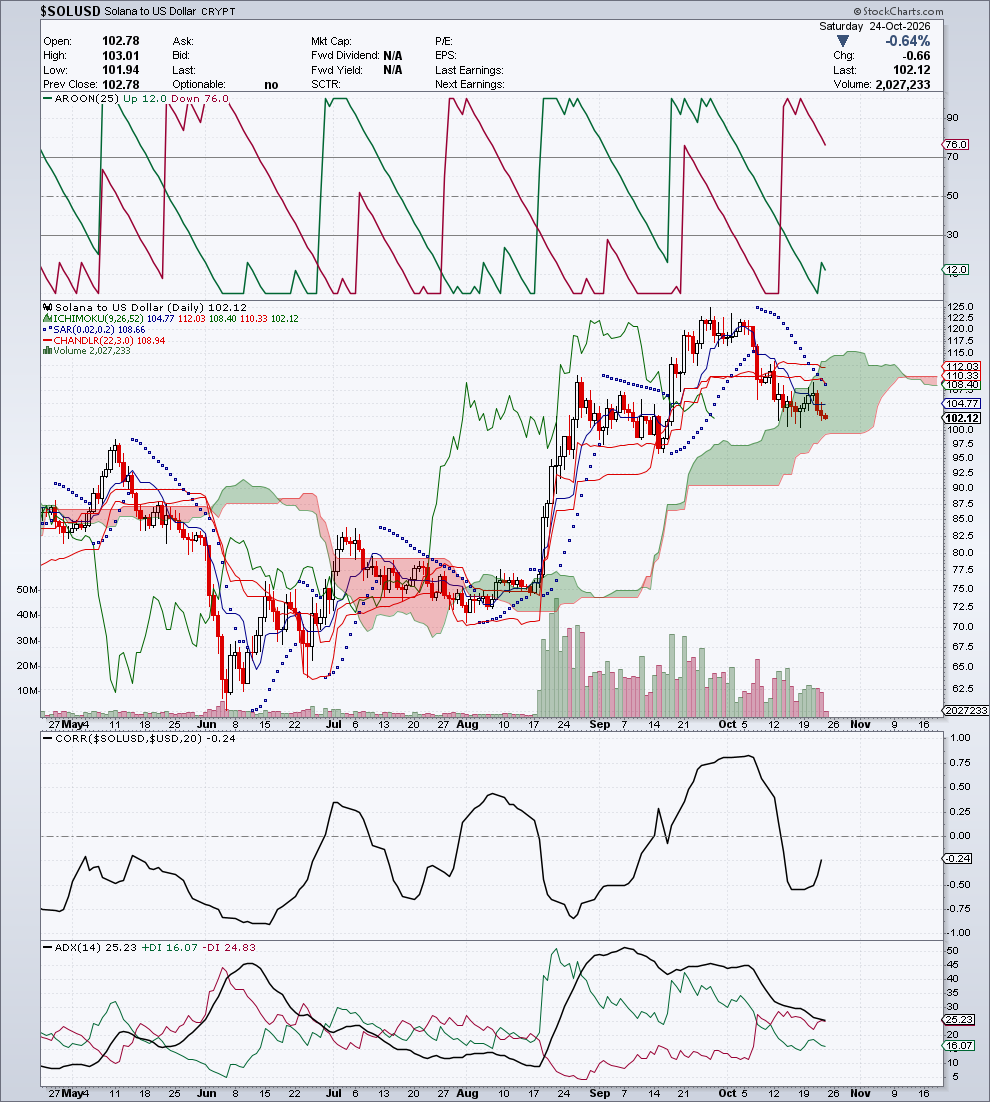
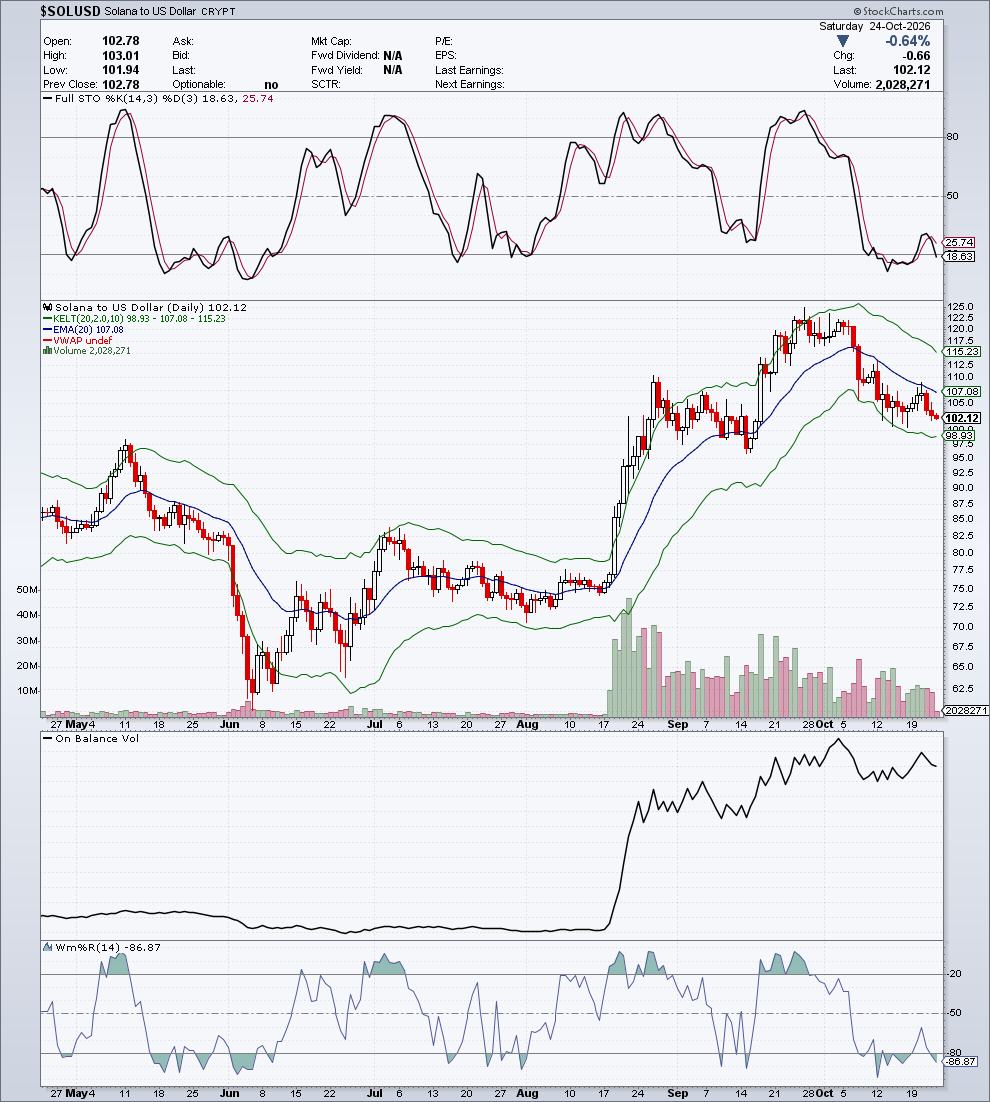
Section produced for Module C — FINBEAR™ Strategic Report — October 24, 2026
⚖️ Cross Comparison — Crypto
| Parameter | BTCUSD | ETHUSD | SOLUSD | Leader |
|---|---|---|---|---|
| Session change | −0.50% | −0.35% | −0.64% | ETHUSD (smallest drop) |
| RSI(14) | 43.87 | 37.82 | 37.25 | BTCUSD |
| ADX (+DI/−DI) | 16.90 (18.53/21.45) | 27.68 (15.44/25.27) | 25.23 (16.07/24.83) | BTCUSD (least −DI) |
| Position vs Kumo | inside (upper part) | inside (lower part) | inside (lower part) | BTCUSD |
| CMF(20) | −0.101 | −0.132 | −0.119 | BTCUSD |
| Correlation vs SPX | n/a | n/a | n/a | — |
| Bias | NEUTRAL-WEAK | BEARISH (tactical) | BEARISH (tactical) | BTCUSD |
Reading: The three cryptos move together, below the SMA50 and above the SMA200, with negative CMF across the board. $BTCUSD is the most orderly, with an ADX of 16.9, no trend and price in the upper part of the cloud. $ETHUSD and $SOLUSD, by contrast, are in a confirmed downtrend (ADX 27.7 and 25.2, −DI dominant) and sit in the lower part of the cloud. None of the three shows a strong correlation with the dollar over the last 20 sessions.
📊 VIX — Equity Volatility ($VIX) — 19.45
Date: Friday, October 23, 2026 | Change: +0.42 (+2.21%) | Volume: n/a (index)
Daily range: 18.87 – 20.66 | Prev. Close: 19.03
Group note: VVIX and the Put/Call Ratio are not available in this edition; the reading of the volatility group is limited to the $VIX. CMF, Force Index and OBV can’t be calculated on an index with no volume.
Indicator Table
| Indicator | Value | Signal | Notes |
|---|---|---|---|
| Trend | Bullish (volatility rising) | 🔴 (flight from risk) | VIX above the SMA200 and the SMA50 |
| SMA 200 | 18.19 | Below the VIX | +6.93% |
| SMA 50 | 15.91 | Below the VIX | +22.25%; tactical average still below the long one |
| Zig Zag (6.25%) | lows ~14 (September) → peak ~22.3 (early in the week) → ~16.6 (Oct 21) → 19.45 | — | Second push after the early-week peak |
| RSI (14) | 61.30 | 🟠 | Strong, not stretched |
| MACD (12,26,9) | 0.765 / 0.420 | 🔴 (for equities) | Histogram +0.345; line above the signal line, rising |
| ATR (14) | 1.800 | ↑ | Expanding sharply from the mid-October lows (~1.1) |
| Bollinger (20,2) | 13.50 / 16.54 / 19.57 | upper band | VIX hugging the upper band |
| Pivot Points | P 16.36 · R1 18.92 · R2 21.50 · S1 13.78 · S2 11.22 | between R1 and R2 | R1 cleared |
| Volume by Price | n/a | — | Index with no volume |
| CMF (20) | n/a | — | Index with no volume |
| Force Index (13) | n/a | — | Index with no volume |
| Ulcer Index (14) | 6.36 | medium-high | — |
| Ichimoku Full | 18.65 / 18.22 / 18.43 / 18.06 | 🔴 (flight from risk) | VIX above Tenkan, Kijun and Kumo (the last two values are the projected Spans) |
| Parabolic SAR | 16.51 | 🔴 (for equities) | Below the VIX: volatility trend pointing up |
| Chandelier Exit (22,3) | 17.29 | — | Below the VIX |
| Aroon (25) | Up 80 / Down 12 | 🔴 (for equities) | Up dominant |
| Correlation vs $USD (20) | −0.39 | − | Moderate inverse |
| ADX (14) | 35.95 (+DI 38.59 / −DI 8.68) | 🔴 (for equities) | Volatility uptrend, strong and accelerating |
| Keltner Channels (20,2,10) | 13.06 / 16.94 / 20.82 | upper half | Below the upper band |
| EMA (20) | 16.94 | Below the VIX | +14.82% |
| VWAP | n/a | — | Index with no volume |
| Stochastic (14,3,3) | 47.97 / 40.79 | ⚪ | Mid-scale, %K above %D |
| OBV | n/a | — | Index with no volume |
| Williams %R (14) | −37.93 | ⚪ | Upper part of the scale |
Analytical Commentary
The $VIX Compass is based on an ETF that tracks volatility futures, whose price erodes over time by construction. The bearish regime and the structural bear in the box bake in that erosion and shouldn’t be read as calm in equities. The number that matters is a different one: recent momentum contradicts the regime, with the short- and medium-term readings pulling in opposite directions, and the Compass suspends judgment. The four layers are sharper: volatility has shifted gear over the past week, and it says so with its highest ADX since May.
Candlestick. October 23’s candle is white with a long upper shadow: open 19.18, high 20.66, close 19.45. Fear climbed during the session and was then partly absorbed, but the close still sits above the previous day’s. It’s the second push in a few days, after the 22.3 peak early in the week, which also left a long shadow and was turned back the same day.
Moving Averages. The VIX is above the SMA200 (18.19), the SMA50 (15.91) and the EMA20 (16.94). The 50-day is still below the 200-day, a leftover of the August-September calm, but it has hooked upward. For the VIX, trading above its averages means stress for equities.
Ichimoku Kinko Hyo. The VIX has broken out above the red Kumo, which had capped it for months, and sits above Tenkan (18.65) and Kijun (18.22). The SAR (16.51) is below, so volatility’s short-term structure is bullish.
Bands & Levels. The VIX is working right up against the upper Bollinger band (19.57), below the upper Keltner band (20.82). It has cleared pivot R1 (18.92); the next reference is R2 (21.50), just below the early-week peak.
Oscillators & Flows. Here’s the real show of strength: ADX at 35.95 with +DI (38.59) towering over −DI (8.68), Aroon Up at 80 against Down at 12, MACD above the signal line and rising, ATR up from about 1.1 to 1.8 in two weeks. RSI (61.3) and stochastic (48.0) aren’t stretched. Volatility is rising in good order, without the flare-up that usually comes before a quick deflation. The stress is there, but it isn’t panic.
🏛️ Pretore signature for the week:
- Mon:
active long→ Fri:active long— Δ unchanged - Operational stop, Friday close: 16.4367 (VIXY proxy scale)
The signature is calculated on the VIXY proxy: consistent with the rise in the VIX index, that is, with growing stress for equities.
🧭 Asset Compass ($VIX) · Friday close, October 23, 2026
  VERDICT           CONTRADICTED     — recent momentum contradicts
  OPERATING REGIME  STRONG BEAR
  LINEARITY         Ordinary trends
  COHERENCE         NONE
  RELIABILITY       SUSPENDED
  POSITION          in band          — just above the underlying trend
  UNDERLYING TREND  Structural bear  — solid
Quantitative reading of the asset’s regime: the bearish regime and underlying trend also reflect the structural erosion of the futures ETF the box is based on. Recent momentum contradicts the regime and the short- and medium-term readings pull in opposite directions. The regime is contested, and the Compass suspends judgment and says wait, don’t bet on where it goes. On the index itself, the four-layer technical report is sharper than the quantitative reading.
Detected Patterns
| Pattern | Status |
|---|---|
| Breakout above the Kumo | ✅ Confirmed |
| Peak with a long upper shadow (early in the week) and second push (Oct 22-23) | ✅ Confirmed |
| ATR expansion with an accelerating ADX | ✅ Confirmed |
📌 Operating Scenario
| Item | Description |
|---|---|
| Primary scenario | Elevated volatility consolidating between 18 and 21.5: persistent stress, not panic |
| Conditions | Holding above the SMA200 (18.19), with the current Kumo further below, and the ADX still rising |
| Key support | 18.92 (R1) → 18.19 (SMA200) → 17.29 (Chandelier) → 16.51-16.54 (SAR and Bollinger midline) |
| Key resistance | 19.57 (upper Bollinger) → 20.66 (Oct 23 high) → 21.50 (R2) → ~22.3 (early-week peak) |
| Warning level | Close above 21.50: stress accelerates toward the October peak. Close below 18.19: the rise in volatility unwinds |
| Estimated timing | 1-2 weeks |
BIAS: BULLISH (volatility) — negative for equities. Above 18.19 the CENTRAL THESIS holds; below the SMA200 the ALTERNATIVE SCENARIO of a pullback takes over.
🎯 FINBEAR Verdict
Direction: 🔴 Volatility rising (flight from risk)
| Scenario | Trigger | Target | Note |
|---|---|---|---|
| ▶▶▶ CENTRAL THESIS — Persistent stress | Holds above 18.19 | 20.66 → 21.50 | Strong ADX, oscillators not stretched |
| ▶▶ ALTERNATIVE SCENARIO — Pullback | Close below 18.19 (SMA200) | 17.29 → 16.51 | The long shadows say the spikes get sold |
| ▶ TAIL SCENARIO — Acceleration | Close above 21.50 | ~22.3 (early-week peak) | Would need an external catalyst |
📡 Operating levels, decision dashboard and summary verdict for this asset → CTM Signal™
📎 This week the VIX did something it hadn’t done in months: it broke out of the cloud that had kept it compressed and stayed above it, with a confirmed trend. The chart doesn’t say why fear is back, or whether the people buying it are the same ones selling stocks. That story lives in the RADAR Pro Elite. Fear that climbs in good order is more serious than fear that explodes and burns out in a day.
📈 Technical Charts — $VIX
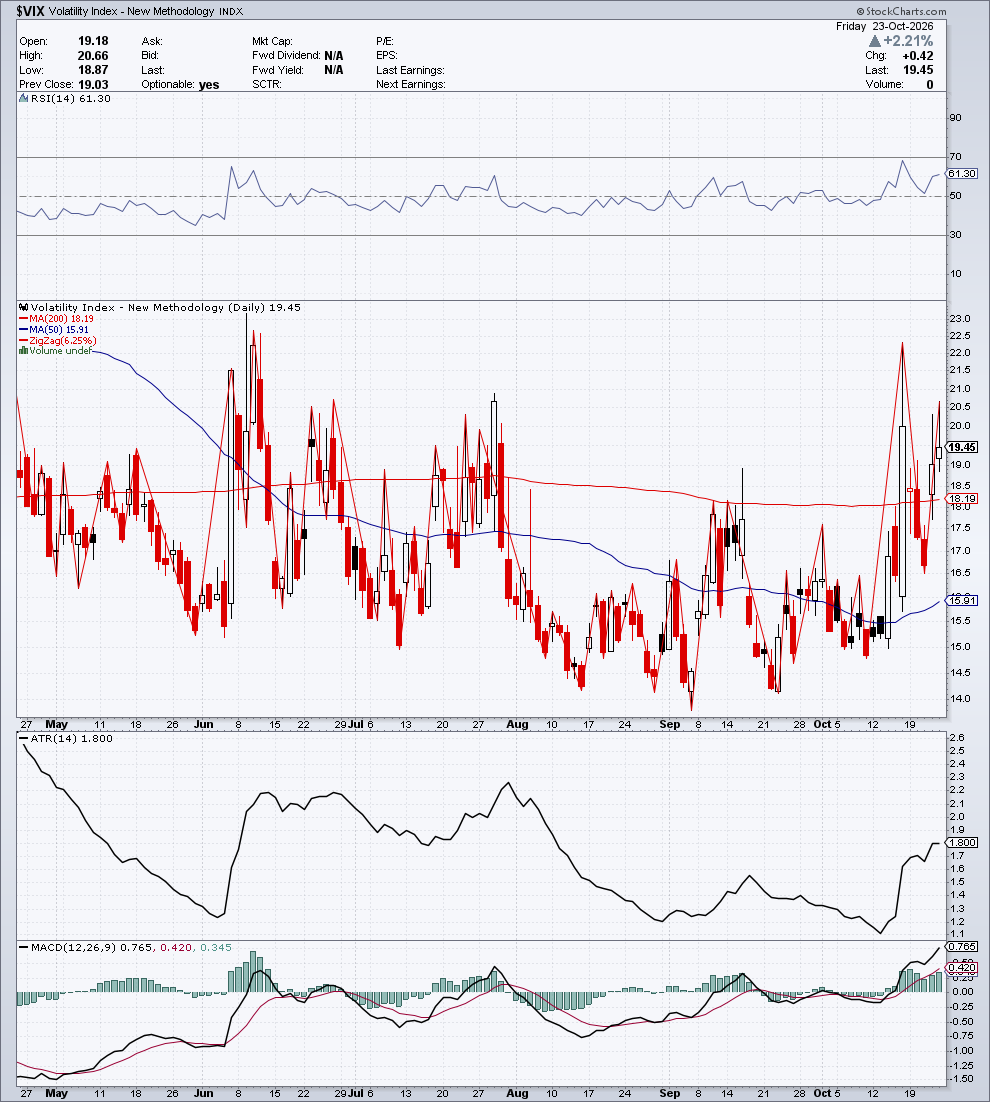
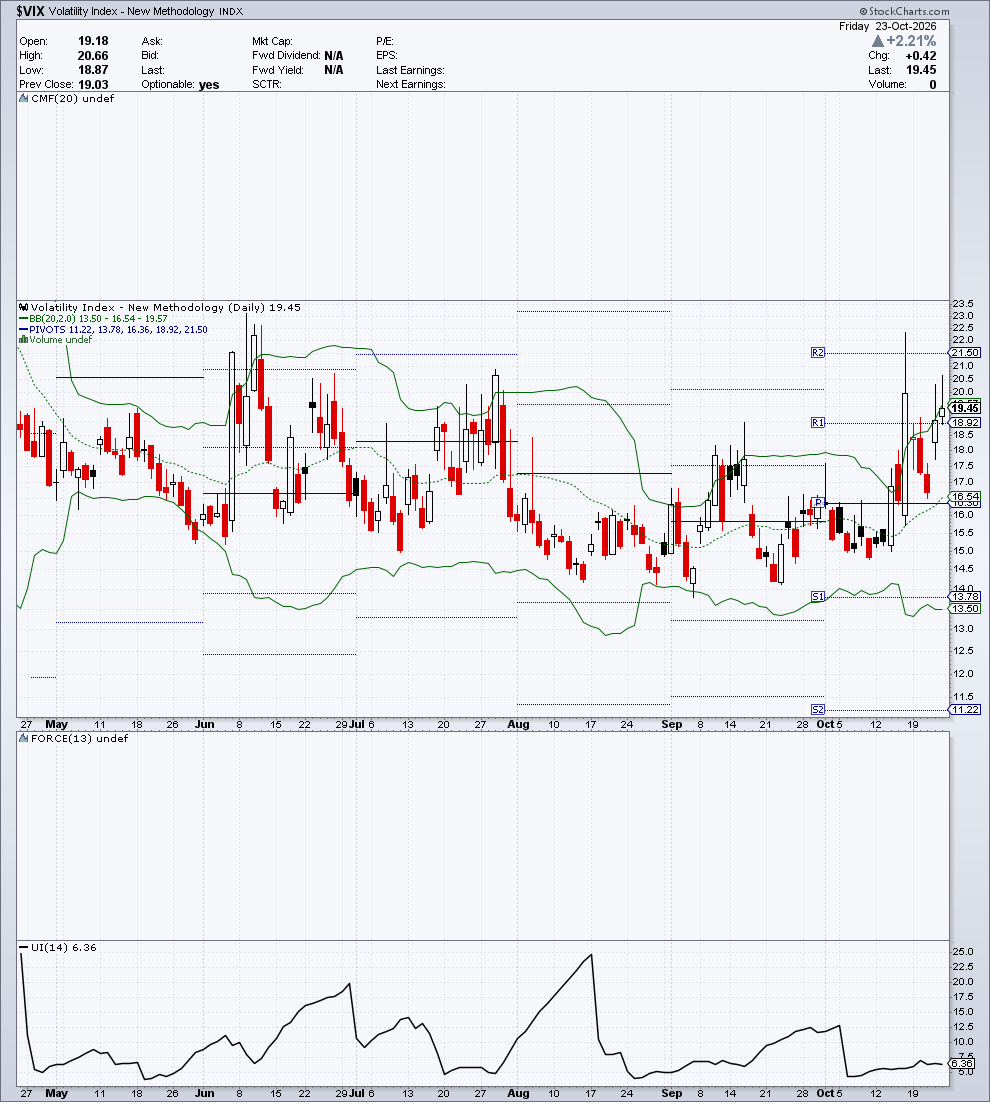
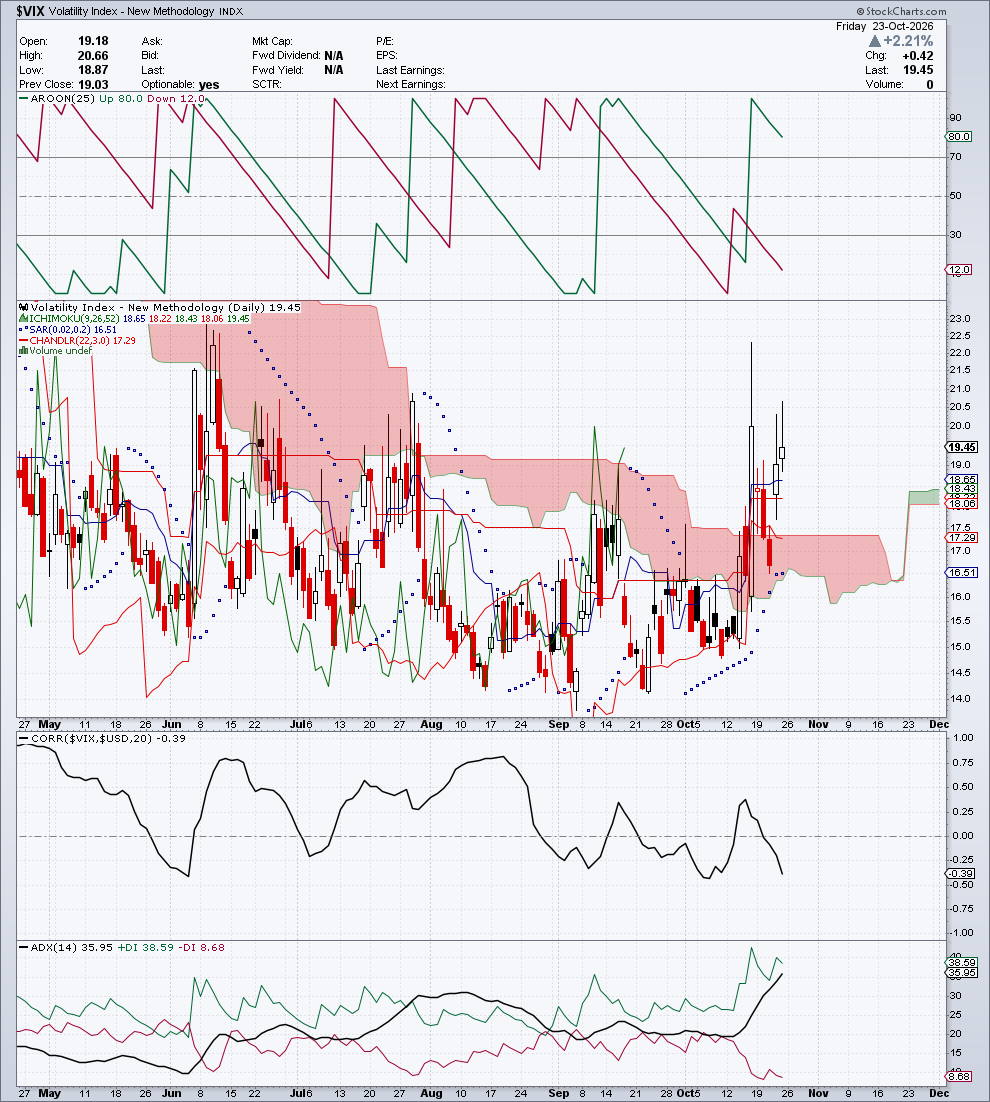
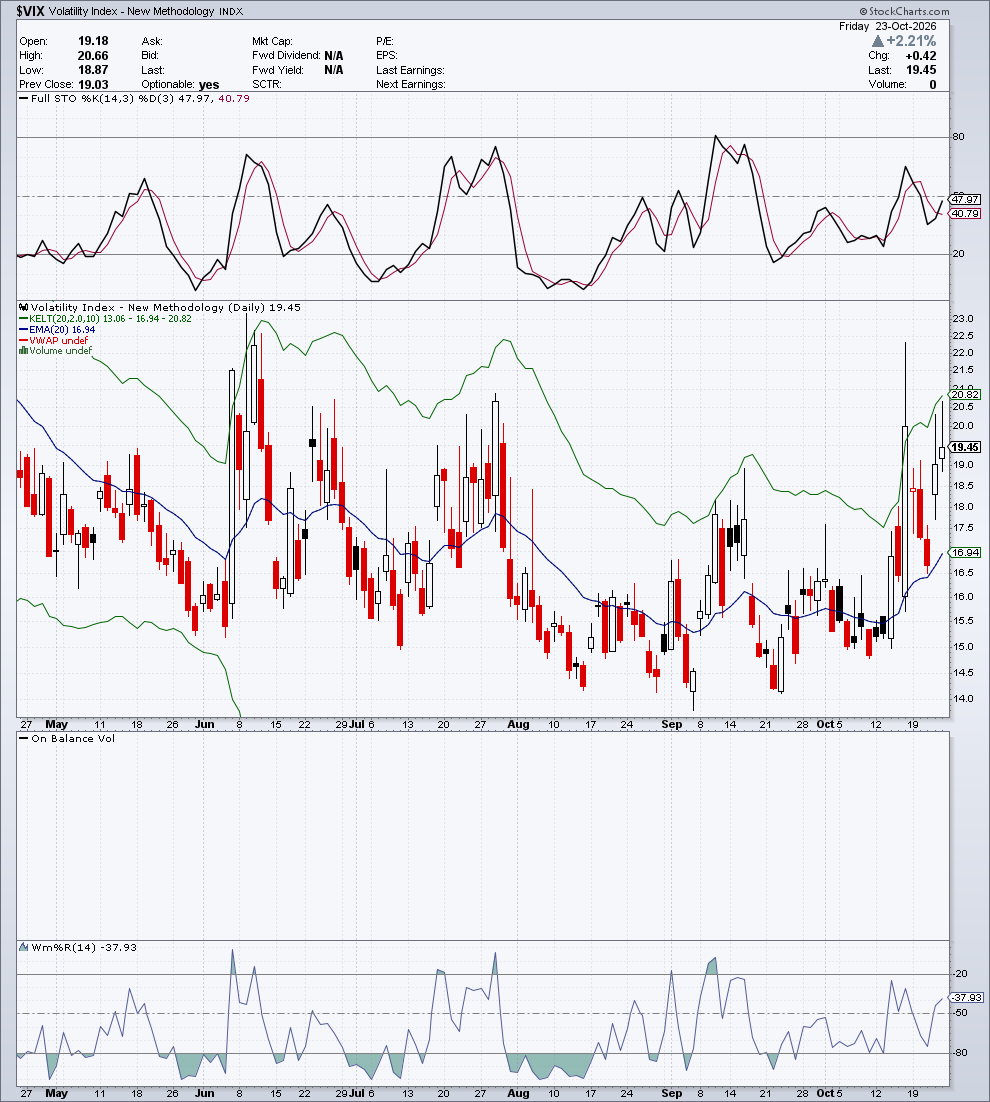
Section produced for Module C — FINBEAR™ Strategic Report — October 24, 2026
📐 Yield Curve · Friday close, October 23, 2026
Shape: flat · Move: unchanged · Macro: normal
- Macro reading — The Treasury curve stays flat and doesn’t change shape during the session. The short end and the 10-year move together, with neither steepening nor flattening. There’s no inversion, so no recession alarm from the term structure; but a flat curve with the 10-year around 5% says the market wants almost the same compensation to lend for two years as for ten: the cost of time is high across every maturity, not just at the short end.
- Reading for the banks — For anyone who lives on short-term funding and long-term lending, a flat curve squeezes net interest margin, and the edge from maturity transformation wears thin. The big banks, with diversified revenue and fee income, absorb it better; the regionals, more dependent on margin, feel it first. That’s the frame for reading the financial sector that follows.
🏦 Financial Sector — under observation
Three instruments, one question: is October’s rebound the whole sector’s, or just one part of it? A descriptive reading, outside the panel aggregates.
🏦 XLF — Sector · 55.90 (−1.32%)
Pretore reading (descriptive) · Friday close, October 23
- Average cost from the low: price is above the average cost of those who bought from the October 1 low, and also above that of those who came in at the early-September high, so both cohorts are in profit. Price state ordinary, inside the bands.
- Support/Resistance: on Friday it lost the 56.5-56.7 zone, which turns into resistance along with 57.0; below, the first footholds are 56.0 and 55.5, then 54.9. Higher up, the September high around 58.5.
4-layer reading:
- Candlestick / Structure — A lower open (56.19 against Thursday’s 56.65) and a close near the session low (55.81) make a red candle that wipes out the previous session’s gain and puts price a whisker below the 50-day average (55.98). The underlying structure stays bullish: the 50-day sits above the 200-day (53.36), and the recovery from the October 1 low (52.81) traces a V that’s still intact.
- Ichimoku — The rebound ran into the lower edge of the cloud and bounced off it; the cloud opening up ahead is red. Tenkan (55.34) above Kijun (54.74) and the SAR below price (55.08) keep the short-term signal on; the cloud remains the ceiling to reclaim.
- Bands & Levels — On Thursday price had touched the upper Bollinger band (56.53) and pivot R1 (56.74); on Friday it slipped back inside the channel, between the central pivot (55.05) and R1. The upper Keltner band (56.74) coincides with R1: a double threshold, and for now it’s holding.
- Oscillators & Flows — Momentum is the tidiest of the trio: ADX 25.52 with +DI 34.46 well above −DI 18.38, Aroon Up 96 against Down 36, MACD (0.123) back above zero with a positive histogram. Flows go along with it: CMF 0.131, a positive Force Index, OBV rising since early October. The stochastic (90.7) and Williams %R (−23.6) say short-term momentum has already run; the Ulcer Index at 0.52 says the recent road has had few potholes.
🏦 KBWB — Large Banks · 87.56 (−0.75%)
Pretore reading (descriptive) · Friday close, October 23
- Average cost from the low: price is just above the average cost of those who bought from the October 14 low, but below that of those who came in at the mid-August high: the dip buyers are barely up, the summer crowd is still underwater. Price state compressed: narrow bands, no extension.
- Support/Resistance: the 87.7-88.4 zone, one of the most tested of the year (nine touches), turned price back on Friday; above sits 88.9, then 90.1. Below, the footholds are 86.9 and 85.4, with the October low around 84.3.
4-layer reading:
- Candlestick / Structure — A small candle with a lower shadow (low 87.00, close 87.56): indecision below the 200-day average (88.08), which has been acting as a lid since early October. The 50-day (91.68) is falling decisively and closing in on the 200-day, the picture of an instrument that has dropped out of its summer trend and now moves sideways between 84 and 89.
- Ichimoku — Price is well below the cloud, which remains red and well above price ahead; the Kijun (88.46) sits above price, the Tenkan (86.67) below. The SAR (84.39) is below price and signals a short-term truce, not a reversal.
- Bands & Levels — Tight Bollinger bands (85.75-88.81) with price on the midline (87.28): textbook compression, waiting for a direction. Price is below the central pivot (90.64) and far from S1 (83.78). The 20-day EMA (88.00) coincides with the 200-day average and with the resistance zone: three hurdles in the same spot.
- Oscillators & Flows — Here flows tell a different story from price, with CMF at 0.193, the highest in the trio, and OBV rebounding vertically since mid-October. Momentum isn’t following yet, though: ADX 26.34 with −DI 28.43 just above +DI 25.99, Aroon Down 72 against Up 4, MACD below zero (−1.134) despite a positive histogram. Money coming in, price not breaking through: accumulation under a ceiling.
🏦 KRE — Regional Banks · 72.46 (+0.07%)
Pretore reading (descriptive) · Friday close, October 23
- Average cost from the low: price is above the average cost of those who bought from the October 14 low and in line with that of those who came in at the early-August high, so breakeven for the summer buyers is within reach. Price state extended in the short term: a close outside the upper Bollinger band.
- Support/Resistance: price is moving between support at 71.0-71.9 (ten touches) and resistance at 72.4-73.2, already grazed on Friday (high 72.79). Beyond that, 74.0 and 75.3; below support, 70.2.
4-layer reading:
- Candlestick / Structure — A white candle that confirms Thursday’s breakout: a second straight close above the 50-day average (72.15), something that hadn’t happened since August, with the 200-day (70.18) now behind it. The October 14 low (67.79) is where the rally started.
- Ichimoku — Price has moved closer to the cloud, whose lower edge is still about 2% higher, and the cloud opening up ahead is red: that’s where the real test lies. Tenkan and Kijun, side by side (70.29 and 70.33), sit below price and the SAR is at 68.10, so the short term is on the buyers’ side.
- Bands & Levels — A close above the upper Bollinger band (72.04), with the upper Keltner band at 73.27 and pivot R1 at 73.30. There’s still a little room before the double ceiling, but price is running outside the channel. The central pivot (71.21) is behind it.
- Oscillators & Flows — The change of pace is clear-cut: ADX 25.39 with +DI 30.45 above −DI 20.64, MACD with a positive histogram (0.487) and the line climbing toward zero, Force Index at its highest since July. CMF (0.009) has only just turned positive after weeks of outflows, and OBV is rising. Aroon (Up 4, Down 72) hasn’t yet registered a new 25-session high; the stochastic at 90.7 and Williams %R at −6.7 are in overbought territory.
Sector Summary
The usual script has the big banks holding up and the regionals cracking first when rates bite. This week the script is flipped: the regionals are leading the rebound, above both averages and outside the bands, while the big banks stay compressed below the 200-day, with money flowing in but price stuck under the ceiling. XLF sits in the middle: bullish structure intact, momentum checked by the edge of the cloud. The yield curve, flat and unchanged in Friday’s session, gives the net interest margin no tailwind. The regionals’ recovery doesn’t come from a steepening curve, but from a rebound off the mid-October lows with money flowing back in. A rebound without the curve’s support needs price to confirm it: the red cloud above KRE and the 200-day above KBWB are next week’s two tests.
Sector under observation — not consolidated. A reading, not a signal.
PART V — INTEGRATED CROSS-ASSET READING
Cross-Asset Correlation Map
| Ticker | Correlation vs $USD (20 sessions) | Strength | Implication |
|---|---|---|---|
| $EURUSD | −0.85 | 🔴 strong inverse | The dollar’s mirror: no story of its own |
| $SPX | +0.69 | 🟢 strong direct | Stocks and the dollar move together: possibly reflecting the same high-rate regime |
| $COPPER | +0.52 | 🟢 strong direct | Odd for a metal: it follows the dollar instead of taking the hit |
| $COMPQ | +0.50 | 🟡 moderate direct | Like the S&P, tied to the same regime |
| $NDX | +0.42 | 🟡 moderate direct | A moderate link, weaker than the S&P and the Composite |
| $VIX | −0.39 | 🟡 moderate inverse | Fear isn’t rising with the dollar: it has an engine of its own |
| $MOVE | −0.26 | ⚪ weak | Rate volatility cut loose from the currency |
| $ETHUSD | −0.26 | ⚪ weak | — |
| $GOLD | +0.25 | ⚪ weak | No strong link to the dollar |
| $SOLUSD | −0.24 | ⚪ weak | — |
| $TNX | +0.23 | ⚪ weak | The 10-year and the dollar have stopped walking in step |
| $SOX | +0.21 | ⚪ weak | — |
| $WTIC | −0.15 | ⚪ weak | Oil is running for reasons of its own |
| $INDU | −0.15 | ⚪ weak | — |
| $BTCUSD | −0.09 | ⚪ none | — |
| $SILVER | +0.07 | ⚪ none | — |
| $BRENT | −0.03 | ⚪ none | Brent doesn’t ask the dollar for permission |
Reading the Map
Inner circle (absolute correlation above 0.50): only $EURUSD is truly hooked to the dollar, and mechanically so. $SPX and $COPPER show a strong direct correlation, which is an anomaly by textbook standards. With rates near 5%, the most plausible reading is that stocks and the dollar are reacting to the same factor rather than to each other.
Middle circle (absolute correlation 0.30-0.50): $COMPQ, $NDX and $VIX, sensitive to the currency but driven by engines of their own.
Outer circle (absolute correlation below 0.30): everything else, starting with the week’s two stories. Oil rises and gold falls with weak correlations to the dollar: $BRENT −0.03, $WTIC −0.15, $GOLD +0.25. The panel’s two strongest divergences show no strong link to the currency.
The Four Critical Divergences
1. Gold vs Oil — The haven that gives no shelter
| Parameter | $GOLD | $BRENT |
|---|---|---|
| Friday change | −0.75% | +3.30% |
| Position | below 4,000, outside Bollinger and Keltner | new period high, above the upper Bollinger |
| RSI(14) | 33.40 | 72.20 |
| Pretore signature (Fri) | active short (flipped from active long) |
active long |
The textbook says an energy shock lifts gold as a hedge. This week the opposite happened: crude hit its period high and gold broke 4,000. The reading the charts allow is that the market is treating expensive oil as a rates problem, not a fear problem. With the 10-year near 5% and the dollar trending, holding a metal that yields nothing costs more. As long as this divergence stays open, the haven gives no shelter.
2. Nasdaq 100 vs Dow Jones — The generals and the old guard
| Parameter | $NDX | $INDU |
|---|---|---|
| ADX (+DI/−DI) | 24.79 (14.12/39.68) | 20.43 (29.52/21.46) |
| MACD | below the signal line and below zero | above the signal line and above zero |
| CMF(20) | −0.089 | +0.083 |
| Ulcer Index | 4.42 | 0.45 |
The Nasdaq’s hundred leaders have −DI nearly triple +DI and money flowing out; the Dow has positive momentum, money flowing in and the lowest cost of holding in the equity panel. This isn’t a flight from equities: it’s a rotation out of the AI trade into the traditional economy, consistent with expensive energy that rewards those who produce it and punishes those who have to fund future growth at high rates.
3. Fear vs Price — Volatility is running ahead of the indices
| Parameter | $VIX | $MOVE | $SPX |
|---|---|---|---|
| Last | 19.45 | 103.31 | 7,623.68 |
| Relative to SMA200 | above (+6.93%) | above (+34.4%) | above (+4.6%) |
| ADX | 35.95 | 31.00 | 14.39 |
The S&P sits just below its SMA50 with no trend; the VIX has a confirmed uptrend and has broken out of the cloud, and the MOVE is more than a third above its long average. Protection costs more than index prices justify — risk managers are hedging before the tape actually falls. Divergences like this close one of two ways: either fear backs off, or price catches up with it.
4. Semiconductors — The expert witness and the Pretore on the same average
| Parameter | CTM reading | Pretore reading |
|---|---|---|
| Direction | 🔴 Tactical bear, confirmed downtrend | active long at Friday’s close |
| Reference | SMA200 at 10,690; below, 10,559 and S2 at 10,435, then the 8,430 area | Invalidation on a close below 10,558.62 |
| Key signal | ADX 25.6 with −DI at 41.5, MACD histogram widening below zero | Friday’s candle opened below the SMA200 and closed above it |
$SOX is the only asset in the panel where the technical report and the Pretore contradict each other at the week’s close. The CTM confirms a downtrend that shows no sign of exhaustion; the Pretore opens a case for a rebound at the 200-day average, right where the most violent fall in the equity panel came to a halt. This is exactly the case the Pretore exists for: speaking first, before the state indicators have changed their minds. Price will write the verdict, around 10,558.
Regime Matrix — Who Runs What
| Regime | Assets | Feature | Main risk |
|---|---|---|---|
| Strong downtrend | $EURUSD, $SILVER, $ETHUSD, $SOX, $SOLUSD | ADX above 25 with −DI dominant | Widespread oversold: violent technical bounces |
| Strong uptrend | $WTIC, $USD | ADX above 30 with +DI dominant | Extension: WTIC is above the upper Bollinger |
| Volatility uptrend | $VIX, $MOVE | ADX above 30, above the averages | Stress spilling over into index prices |
| Trend in correction | $TNX | ADX 30, but −DI has crossed above +DI | A break of the SMA50 would change the underlying reading |
| Emerging trend | $GOLD (−DI), $COMPQ (−DI), $NDX (−DI), $BRENT (+DI), $INDU (+DI) | ADX between 20 and 25 | Confirmed or rejected in the coming sessions |
| Distribution | $COMPQ, $ETHUSD, $SOLUSD, $BTCUSD, $NDX, $SPX | Negative CMF | Outflows running ahead of price |
| Equilibrium | $SPX, $BTCUSD, $COPPER | ADX below 20 | Directionless moves, false signals |
Comparative Rankings
ADX Above 25 — Assets in a Confirmed Trend
| Asset | ADX | +DI / −DI | Dominant direction |
|---|---|---|---|
| $EURUSD | 46.94 | 11.11 / 25.89 | 🔴 −DI |
| $USD | 37.56 | 21.29 / 16.46 | 🟢 +DI |
| $VIX | 35.95 | 38.59 / 8.68 | 🟢 +DI |
| $MOVE | 31.00 | 32.06 / 18.04 | 🟢 +DI |
| $WTIC | 30.32 | 28.17 / 7.58 | 🟢 +DI |
| $TNX | 30.27 | 22.45 / 27.55 | 🔴 −DI |
| $SILVER | 30.04 | 9.94 / 30.51 | 🔴 −DI |
| $ETHUSD | 27.68 | 15.44 / 25.27 | 🔴 −DI |
| $SOX | 25.55 | 15.08 / 41.45 | 🔴 −DI |
| $SOLUSD | 25.23 | 16.07 / 24.83 | 🔴 −DI |
RSI Ranking — From Weakest to Strongest
| # | Asset | RSI(14) | Zone |
|---|---|---|---|
| 1 | $SILVER | 31.24 | weak |
| 2 | $SOX | 32.31 | weak |
| 3 | $GOLD | 33.40 | weak |
| 4 | $EURUSD | 35.18 | weak |
| 5 | $NDX | 36.67 | weak |
| 6 | $SOLUSD | 37.25 | weak |
| 7 | $ETHUSD | 37.82 | weak |
| 8 | $COMPQ | 38.01 | weak |
| 9 | $TNX | 40.71 | neutral |
| 10 | $SPX | 42.15 | neutral |
| 11 | $BTCUSD | 43.87 | neutral |
| 12 | $COPPER | 44.76 | neutral |
| 13 | $INDU | 52.48 | neutral |
| 14 | $USD | 55.32 | neutral |
| 15 | $MOVE | 55.76 | neutral |
| 16 | $VIX | 61.30 | strong |
| 17 | $WTIC | 65.87 | strong |
| 18 | $BRENT | 72.20 | overbought |
Ulcer Index Ranking — The Cost of Staying in the Market
| # | Asset | Ulcer(14) | Stress |
|---|---|---|---|
| 1 | $SOX | 11.88 | high |
| 2 | $SILVER | 6.50 | medium-high |
| 3 | $VIX | 6.36 | medium-high |
| 4 | $SOLUSD | 5.87 | medium-high |
| 5 | $MOVE | 4.56 | medium-high |
| 6 | $ETHUSD | 4.44 | medium-high |
| 7 | $NDX | 4.42 | medium-high |
| 8 | $COMPQ | 3.50 | medium |
| 9 | $TNX | 2.93 | medium |
| 10 | $BTCUSD | 2.34 | low |
| 11 | $COPPER | 2.23 | low |
| 12 | $GOLD | 1.95 | low |
| 13 | $WTIC | 1.76 | low |
| 14 | $SPX | 1.27 | low |
| 15 | $USD | 0.54 | low |
| 16 | $BRENT | 0.51 | low |
| 17 | $INDU | 0.45 | low |
| 18 | $EURUSD | 0.41 | low |
⚔️ Weekly Tensions — CTM vs Pretore
Assets where the CTM’s multi-layer technical reading and the Pretore signature at the week’s last snapshot (Friday’s close; for crypto, the Thursday, October 22 bar) point in different directions:
| Asset | CTM Verdict | Pretore signature (Fri) | Implication |
|---|---|---|---|
| $SOX | 🔴 Tactical bear on the SMA200 | active long (from Monday’s active short) |
The Pretore reads the defense of the 200-day average as the first sign of a turn; the CTM still sees a confirmed downtrend (ADX 25.6, −DI 41.5). The Pretore is speaking first, and against the technical reading: a close below 10,558.62 would invalidate the signature and prove the CTM right, while holding above the SMA200 and reclaiming 10,979 would prove the Pretore right. The detail is in the closing Cross-Examination |
During the week the signature flipped elsewhere too, but in agreement with the technical report or on assets with no directional verdict: $GOLD, $SILVER and $EURUSD moved from active long to active short, falling into line with the bearish CTM; $COPPER went from active short to active long, on a sideways CTM verdict. The three cryptos made a round trip. Solana was already bullish on the October 19 bar, Bitcoin and Ethereum turned bullish on the October 20 bar; all three were back to active short on the October 22 bar, in line with the correction the CTM describes.
The $NDX and $COMPQ signatures match (active short for both), so the Nasdaq’s concentration and its breadth read the week the same way, and there’s no divergence between the two to flag.
Summary Verdict
🟢 Bullish axis — Who’s on the right side
| Asset | Key signal | Engine |
|---|---|---|
| $BRENT | New period high, RSI 72.2 | Global energy |
| $WTIC | ADX 30.3, +DI nearly four times −DI | US energy |
| $USD | ADX 37.6, above the Kumo | The dollar as a strong denominator |
| $VIX · $MOVE | Confirmed volatility uptrend | Rising stress across stocks and bonds (bad news for risk assets) |
🔴 Bearish axis — Who’s paying the bill
| Asset | Key signal | Engine |
|---|---|---|
| $SOX | On the SMA200 with −DI 41.5, Ulcer 11.88 | Exit from the AI trade |
| $NDX · $COMPQ | −DI nearly triple, negative CMF | Correction in the leaders and in tech breadth |
| $GOLD · $SILVER | Below the Kumo, RSI between 31 and 33 | Opportunity cost with high rates and a strong dollar |
| $EURUSD | ADX 46.9 with −DI dominant | Strong dollar |
| $ETHUSD · $SOLUSD | Confirmed downtrend, negative CMF | Correction inside the crypto world |
⚪ Grey zone — Who’s waiting for the verdict
| Asset | Key signal | Crossroads |
|---|---|---|
| $SPX | SMA50 lost, ADX 14.4 | 7,512 below, 7,727 above |
| $INDU | Bullish MACD, SAR flipped on Friday | 51,585 below, 52,928 above |
| $TNX | Yield sitting on the SMA50 | 4.915% below, 5.145% above |
| $COPPER | ADX 10, sideways range | 6.28 below, 6.59 above |
| $BTCUSD | ADX 16.9, below the SMA50 | 79,600 below, 82,412 above |
The Common Thread
The week’s director is the price of oil. Brent at its period high, with the 10-year near 5% and the dollar trending, sketches a market behaving as if it feared the cost of money more than recession: expensive energy, high rates and, left holding the bill, everything that lives on low rates or on growth far down the road. Semiconductors and the Nasdaq leaders give ground, precious metals lose their safe-haven role, the euro slides, and volatility stays high across stocks and bonds at once. What holds up: energy producers and the old economy.
The Anomaly
Gold. In a week with oil at its period high, equity volatility out of its cloud and bond stress more than a third above its long average, the safe haven par excellence broke 4,000 to the downside, with a Pretore signature that went from active long to active short. The correlation with the dollar is weak, so that number alone can’t make the currency the engine of the decline. It’s the most telling data point in this Module C, because it says this fear isn’t asking for protection. It’s asking for yield.
Evolution from the Previous Module C
Not available in this edition. The asset-by-asset comparison with the previous Module C was not carried out.
Summary Tables
➤ Operating Levels
| Asset | Price | Support 1 | Support 2 | Resistance 1 | Resistance 2 | Warning |
|---|---|---|---|---|---|---|
| $SPX | 7,623.68 | 7,512 | 7,373 | 7,700-7,727 | 7,786 | close below 7,512 |
| $NDX | 28,957.53 | 28,553 | 27,960 | 29,190 | 29,830-29,977 | close below 27,836 |
| $COMPQ | 25,955.34 | 25,748 | 25,165 | 26,299 | 26,599-26,651 | close below 24,992 |
| $INDU | 52,215.16 | 51,721-51,853 | 51,585 | 52,320 | 52,800-52,852 | close below 51,585 |
| $SOX | 10,779.46 | 10,690 (SMA200) | 10,435 | 10,979 | 11,208 | close below 10,435 |
| $USD | 101.75 | 101.55 | 101.27 | 102.20 | 102.54 | close below 101.27 |
| $EURUSD | 1.1205 | 1.1207 | 1.1087 | 1.1261 | 1.1305 | close below 1.1087 |
| $TNX | 4.988% (49.88) | 4.984% | 4.915% | 5.110-5.115% | 5.134-5.145% | close below 4.915% |
| $MOVE | 103.31 | 100.53-99.81 | 98.03 | 107.58 | 111.40-111.89 | close below 94.72 |
| $GOLD | 3,994.60 | 3,975.65 | 3,859.97 | 4,008.88 | 4,097.16 | Futures close above 4,041.76 |
| $SILVER | 53.88 | 53.83 | n/a | 54.62 | 57.13 | Futures close above 53.96 |
| $COPPER | 6.465 | 6.41 | 6.28 | 6.55 | 6.59 | Close below 6.28 |
| $WTIC | 103.45 | 102.74 | 98.75 | 104.69 | 106-107 (area) | Futures close below 102.635 |
| $BRENT | 116.90 | 115.07 | 112.18 | 117.34 | n/a | Futures close below 112.18 |
| $BTCUSD | 80,720.37 | 79,595 | 76,571 | 81,814 | 82,412 | Close below 79,600 |
| $ETHUSD | 2,377.20 | 2,338 | 2,291 | 2,426 | 2,547 | Close below 2,291 |
| $SOLUSD | 102.12 | 100.97 | 97.11 | 104.77 | 106.29 | Close below 97.11 |
| $VIX | 19.45 | 18.92 | 18.19 | 19.57 | 21.50 | Above 21.50 acceleration; below 18.19 pullback |
➤ Consolidated Key Indicators
| Asset | RSI | MACD | Bollinger | Ichimoku | Volume | Trend |
|---|---|---|---|---|---|---|
| $SPX | 42.15 | bearish (below the signal line, just below zero) | lower band | inside (lower part) | 2.76bn | Underlying uptrend, short-term correction |
| $NDX | 36.67 | bearish (below the signal line and below zero) | lower band | hugging the lower edge | 1.04bn | Short-term correction within an underlying uptrend |
| $COMPQ | 38.01 | bearish (below the signal line and below zero) | lower band | inside (lower part) | 6.55bn | Short-term correction within an underlying uptrend |
| $INDU | 52.48 | bullish (above the signal line and above zero) | upper half (rejected at the upper band) | hugging the lower edge (bearish cloud) | 351.7m | Recovery since early October, pausing |
| $SOX | 32.31 | bearish (below the signal line and below zero) | lower band (below the lower Keltner) | well below | n/a | Vertical drop all the way to the SMA200 |
| $USD | 55.32 | bearish (line below the signal line, histogram −0.137) | lower half (midline 101.91) | above | n/a (index) | Uptrend, retracing |
| $EURUSD | 35.18 | bullish (bullish crossover below zero, histogram +0.001) | below the midline (1.1237), bands narrowing | below | n/a (forex) | Downtrend, in a sideways base |
| $TNX | 40.71 | bearish (histogram −0.426, line falling) | just below the lower band (49.96) | above (but below Tenkan/Kijun) | n/a (index) | Underlying uptrend, correcting |
| $MOVE | 55.76 | Line below the signal line (histogram −0.864), in positive territory | on the midline (103.31) | above | n/a (index) | Uptrend (elevated stress) |
| $GOLD | 33.40 | bearish (line below the signal line, histogram −7.84) | below the lower band | below | n/a (spot) | Downtrend |
| $SILVER | 31.24 | bearish (histogram −0.357) | below the lower band | below | n/a (spot) | Downtrend |
| $COPPER | 44.76 | mildly bearish (histogram −0.019) | lower half | inside | n/a (spot) | Sideways (correction within the range) |
| $WTIC | 65.87 | bullish (histogram +0.790) | above the upper band | above | n/a (spot) | Uptrend |
| $BRENT | 72.20 | bullish (histogram +0.846) | above the upper band | above | n/a (spot) | Uptrend |
| $BTCUSD | 43.87 | bearish (line below the signal line, below zero) | lower half, hugging the lower band | inside (upper part) | 25,400 | Corrective within a bullish structure |
| $ETHUSD | 37.82 | bearish (line below the signal line, below zero) | lower half | inside (lower part) | 224,636 | Short-term downtrend within a bullish annual structure |
| $SOLUSD | 37.25 | bearish (line below the signal line, below zero) | lower half | inside (lower part) | 2,025,585 | Short-term downtrend within a bullish annual structure |
| $VIX | 61.30 | bullish for volatility (line above the signal line, above zero) | hugging the upper band | above | n/a | Uptrend (volatility rising) |
➤ Scenario Summary
| Asset | ▶▶▶ Central Thesis | ▶▶ Alternative | ▶ Tail | Estimated Timing |
|---|---|---|---|---|
| $SPX | Orderly correction — 7,512 holds with price below 7,727 | Recovery — Close above 7,727 | Extended correction — Close below 7,512 | 1-2 weeks |
| $NDX | Correction toward the SMA200 — Price below 29,190 | Oversold bounce — Close above 29,190 | Structural break — Close below 27,836 | 1-2 weeks |
| $COMPQ | Correction extending — Price below 26,299 | Oversold bounce — Close above 26,299 | Structural break — Close below 24,992 | 1-2 weeks |
| $INDU | Pause and retest — 51,721-51,853 holds | Correction toward the SMA200 — Close below 51,585 | Rally resumes — Close above 52,928 | 1-2 weeks |
| $SOX | Fragile base on the SMA200 — 10,559 holds with price below 10,979 | SMA200 breaks — Close below 10,435 | Extended technical bounce — Close above 11,208 | 1-2 weeks |
| $USD | Rebound off the EMA20/Kijun line — 101.55 holds + close above 102.20 | Extended pullback — Close below 101.27 | Structure breaks — Close below 100.51 | 1-2 weeks |
| $EURUSD | Sideways base inside the bear — Price between 1.113 and 1.1305 | Technical bounce — Close above 1.1305 (Kijun) | New down leg — Close below 1.1087 (S2) | 1-3 weeks |
| $TNX | Correction on the SMA50 — 4.915% holds with no close above 5.145% | Deep correction — Close below 4.915% (S1) | The climb resumes — Close above 5.145% (Kijun) | 1-2 weeks |
| $MOVE | High stress, stabilized — MOVE between 94.72 and 111.89 | Stress flares up again — Close above 111.89 | Stress eases — Close below 94.72 | 1-3 weeks |
| $GOLD | Bearish continuation — Closes below 4,008.88 (S1) | Oversold bounce — Reclaim of 4,038.75 | Reversal — Close above 4,259.92 (P) | 1-2 weeks |
| $SILVER | Bearish continuation — Closes below 53.83 | Oversold bounce — Back above 54.62 (S2) | Reversal — Close above 58.71 (EMA20) | 1-2 weeks |
| $COPPER | Sideways — 6.41 holds | Bullish recovery — Close above 6.59 and 6.57 | Break of the sideways range — Close below 6.28 (S1) | 1-3 weeks |
| $WTIC | Continuation — 102.74 (R1) holds | Pause and pullback — Close below 102.74 | Reversal — Close below 94.10 (SAR) | 1-2 weeks |
| $BRENT | Continuation with consolidation — 112.18 (futures) holds and price closes above 117.34 | Pullback from overbought — Close below 115.07 | Reversal — Close below 106.83 (EMA20) | 1-2 weeks |
| $BTCUSD | Corrective sideways range — 79,600 holds without reclaiming 81,814 | The base breaks — Close below 79,600 | Rally resumes — Holds above 82,412 and the SMA50 on a closing basis | 1-2 weeks |
| $ETHUSD | Test of the lows — Price below 2,426 (S1) | Slide toward the SMA200 — Close below 2,291 | Recovery — Close above 2,477 | 1-2 weeks |
| $SOLUSD | Test of S1 — Price below 104.77 | Exit from the channel — Close below 97.11 | Oversold bounce — Close above 106.29 | 1-2 weeks |
| $VIX | Persistent stress — Holds above 18.19 | Pullback — Close below 18.19 (SMA200) | Acceleration — Close above 21.50 | 1-2 weeks |
Cross-asset closing line
The market of October 23 is a theater where the lead actor changed halfway through the show. For months the stage belonged to semiconductors, now it belongs to the barrel. Whoever was playing the lead finds themselves bumped to the supporting cast, fear is back in the house and settling into the seats reserved for rates and options, and gold, which usually walks on when the audience gets scared, stays in the wings this time. It isn’t the end of the underlying bull, which remains intact almost everywhere: it’s a change of director, and under a new director the parts get recast.
🎯 FINBEAR Verdict — Integrated Picture
| Asset | Direction | Dominant Scenario | Triggers to watch |
|---|---|---|---|
| $SPX | 🟡 Underlying bull, short term correcting | ▶▶▶ Orderly correction | 7,512 holds with price below 7,727 · warning: close below 7,512 |
| $NDX | 🔴 Correction under way | ▶▶▶ Correction toward the SMA200 | Price below 29,190 · warning: close below 27,836 |
| $COMPQ | 🔴 Correction under way | ▶▶▶ Correction extending | Price below 26,299 · warning: close below 24,992 |
| $INDU | 🟡 Recovery on pause | ▶▶▶ Pause and retest | 51,721-51,853 holds · warning: close below 51,585 |
| $SOX | 🔴 Tactical bear on the SMA200 | ▶▶▶ Fragile base on the SMA200 | 10,559 holds with price below 10,979 · warning: close below 10,435 |
| $USD | 🟡 Bull pausing on the EMA20/Kijun line | ▶▶▶ Rebound off the EMA20/Kijun line | 101.55 holds + close above 102.20 · warning: close below 101.27 |
| $EURUSD | 🔴 Mature bear in a sideways base | ▶▶▶ Sideways base inside the bear | Price between 1.113 and 1.1305 · warning: close below 1.1087 |
| $TNX | 🟡 Yield correcting on the tactical average | ▶▶▶ Correction on the SMA50 | 4.915% holds with no close above 5.145% · warning: close below 4.915% |
| $MOVE | 🔴 High bond stress, consolidating | ▶▶▶ High stress, stabilized | MOVE between 94.72 and 111.89 · warning: close below 94.72 |
| $GOLD | 🔴 Bear, accelerating | ▶▶▶ Bearish continuation | Closes below 4,008.88 (S1) · warning: futures close above 4,041.76 |
| $SILVER | 🔴 Strong bear, the weakest metal in the panel | ▶▶▶ Bearish continuation | Closes below 53.83 · warning: futures close above 53.96 |
| $COPPER | ⚪ Sideways, waiting for a direction | ▶▶▶ Sideways | 6.41 holds · warning: close below 6.28 |
| $WTIC | 🟢 Bull, accelerating | ▶▶▶ Continuation | 102.74 (R1) holds · warning: futures close below 102.635 |
| $BRENT | 🟢 Bull at the highs, stretched in the short term | ▶▶▶ Continuation with consolidation | 112.18 (futures) holds and price closes above 117.34 · warning: futures close below 112.18 |
| $BTCUSD | 🟡 Underlying bull in a tactical correction | ▶▶▶ Corrective sideways range | 79,600 holds without reclaiming 81,814 · warning: close below 79,600 |
| $ETHUSD | 🔴 Trending correction above the SMA200 | ▶▶▶ Test of the lows | Price below 2,426 (S1) · warning: close below 2,291 |
| $SOLUSD | 🔴 Trending correction above the SMA200 | ▶▶▶ Test of S1 | Price below 104.77 · warning: close below 97.11 |
| $VIX | 🔴 Volatility rising (flight from risk) | ▶▶▶ Persistent stress | Holds above 18.19 · warning: above 21.50 acceleration; below 18.19 pullback |
The message in one line: energy, the dollar and volatility rise; tech, precious metals, the euro and crypto pay. The week changed its director, not yet its underlying regime.
🏛️ Aggregate Pretore coherence: 10/18 assets with a Pretore signature in agreement with the CTM verdict (17 assets assessed; $MOVE has no signature; for crypto the latest available snapshot is the October 22 bar). Coherence medium. CTM and Pretore agree on the clean trends (energy, precious metals, tech leaders, the euro, Ethereum, Solana, volatility); on $SPX, $INDU, the dollar, rates, copper and Bitcoin the signature is directional where the technical report is still waiting; on $SOX the two methods contradict each other, and that’s the tension of the week.
🔍 Pretore Cross-Examination — Philadelphia Semiconductor ($SOX)
Activation trigger: test of a decision zone on a key asset. $SOX ends the week right up against its SMA200 (10,690), after piercing it in Friday’s session with a low of 10,667.92.
Sources reviewed: Pretore charts for $SOX at the close on Friday, October 23: P1 daily ZigZag, P2 multi-anchor average-cost prices (automatic anchors from September 14 to October 22 plus cycle references; index without volume, unweighted calculation), P3 subordinate indicators (RSI, moving averages, MACD, ADX).
Pretore signature: present. At Friday’s close the signature flips to active long, from the active short it had held since Monday; the invalidation level is a close below 10,558.6201.
Summary assessment:
- Swing structure: on P1 the first change of direction hasn’t been drawn yet. From the early-October high (around 13,300) the sequence is still one of lower highs and lower lows; the late-July low (around 10,450) is the structural reference beneath the long average. The signature runs ahead of the structure, which is exactly its job.
- Average-cost prices: the only anchor in profit is the one just set at the Thursday, October 22 low, which Friday’s rally cleared. On every other one, including the late-July cycle low, the average buyer is underwater and price sits below their cost basis. The ones defending the SMA200 are those who got in two days ago, not those who’ve been holding for weeks.
- News reaction: outside the scope of this document; the week’s semiconductor news lives in the RADAR Pro Elite.
- Supporting and conflicting evidence: In favor: Friday’s white candle, which opened below the SMA200 and closed above it, and the return above the 10,559 zone. Against: the MACD histogram still widening below zero, the ADX climbing back above 25 with −DI at 41.5, RSI at 32.3 with no bullish divergence. No volume confirmation is possible on an index without volume.
Verdict CTM vs Pretore:
| Method | Verdict | Reading horizon |
|---|---|---|
| Aggregate CTM | 🔴 Tactical bear on the SMA200 | Current state (the photograph) |
| Pretore | active long at Friday’s close, invalidation below 10,558.62 |
Emerging turn (the windshield) |
Convergence / Divergence: divergence. The CTM confirms a downtrend that shows no sign of exhaustion yet; the Pretore opens a case for a rebound at the 200-day average. The signature rests on a single session of defense and a thin margin — about 2% between Friday’s close (10,779) and the invalidation level (10,558).
Operations: the Pretore speaks first; the CTM assesses the established trend. A close below 10,558 would invalidate the signature and hand the week’s reading to the CTM; the next support would be S2 at 10,435, and below that the reference is the 8,430 area. Holding the SMA200 and reclaiming 10,979 would give the turn some substance. The translation into operating conditions is in the Playbook.
📡 The diagnosis is complete. This Module C has read 18 assets through 24 indicators and 4 technical layers. If you want to know what to do with it (decision dashboard, operating levels, scenarios for each asset, summary verdicts), the CTM Signal™ turns this reading into a compass. The diagnosis lives here. The operations live next door.
📜 Disclaimer & Fantiborsa™ Maxim
🛡️ FINBEAR™ Disclaimer:
This technical analysis is not financial advice or an investment recommendation. It’s an independent technical report, for information and education only. The levels are technical references, not calls to action, and the scenarios are conditions, not promises. If you read that Brent is above its upper Bollinger and rush to buy, or that gold has broken 4,000 and rush to sell, the chart isn’t the problem: you skipped straight to the last line. This week’s market made a simple point: the map holds only until the director changes, and no disclaimer has ever protected anyone who mistakes a level for a certainty.